Investors and decision makers have learned to use prediction market data in aggregate, as a forecasting tool that can be more accurate than other methods. Onchain prediction markets also have a second layer of data that can be useful in similar ways: account-level data.
As in any market, whether through luck or information asymmetry, some accounts move first, and are frequently right. Onchain markets surface data that makes it possible to identify those accounts and trace their activity—given the right schema and adequate historical data. With billions in monthly volume, these markets have reached a stage where such signal can be worth obtaining.
To demonstrate how this can be done, we queried Stork Market Data for an example cohort: Polymarket accounts that bet on long odds, hold for days, and win most of the time. We call it the Winning Conviction cohort. This is a simple demonstration. A full study would tune each parameter and backtest the result.
An account joins the cohort if it meets all four tests:
283 accounts pass all four tests. The charts below show a high-level view of Winning Conviction accounts’ activity.
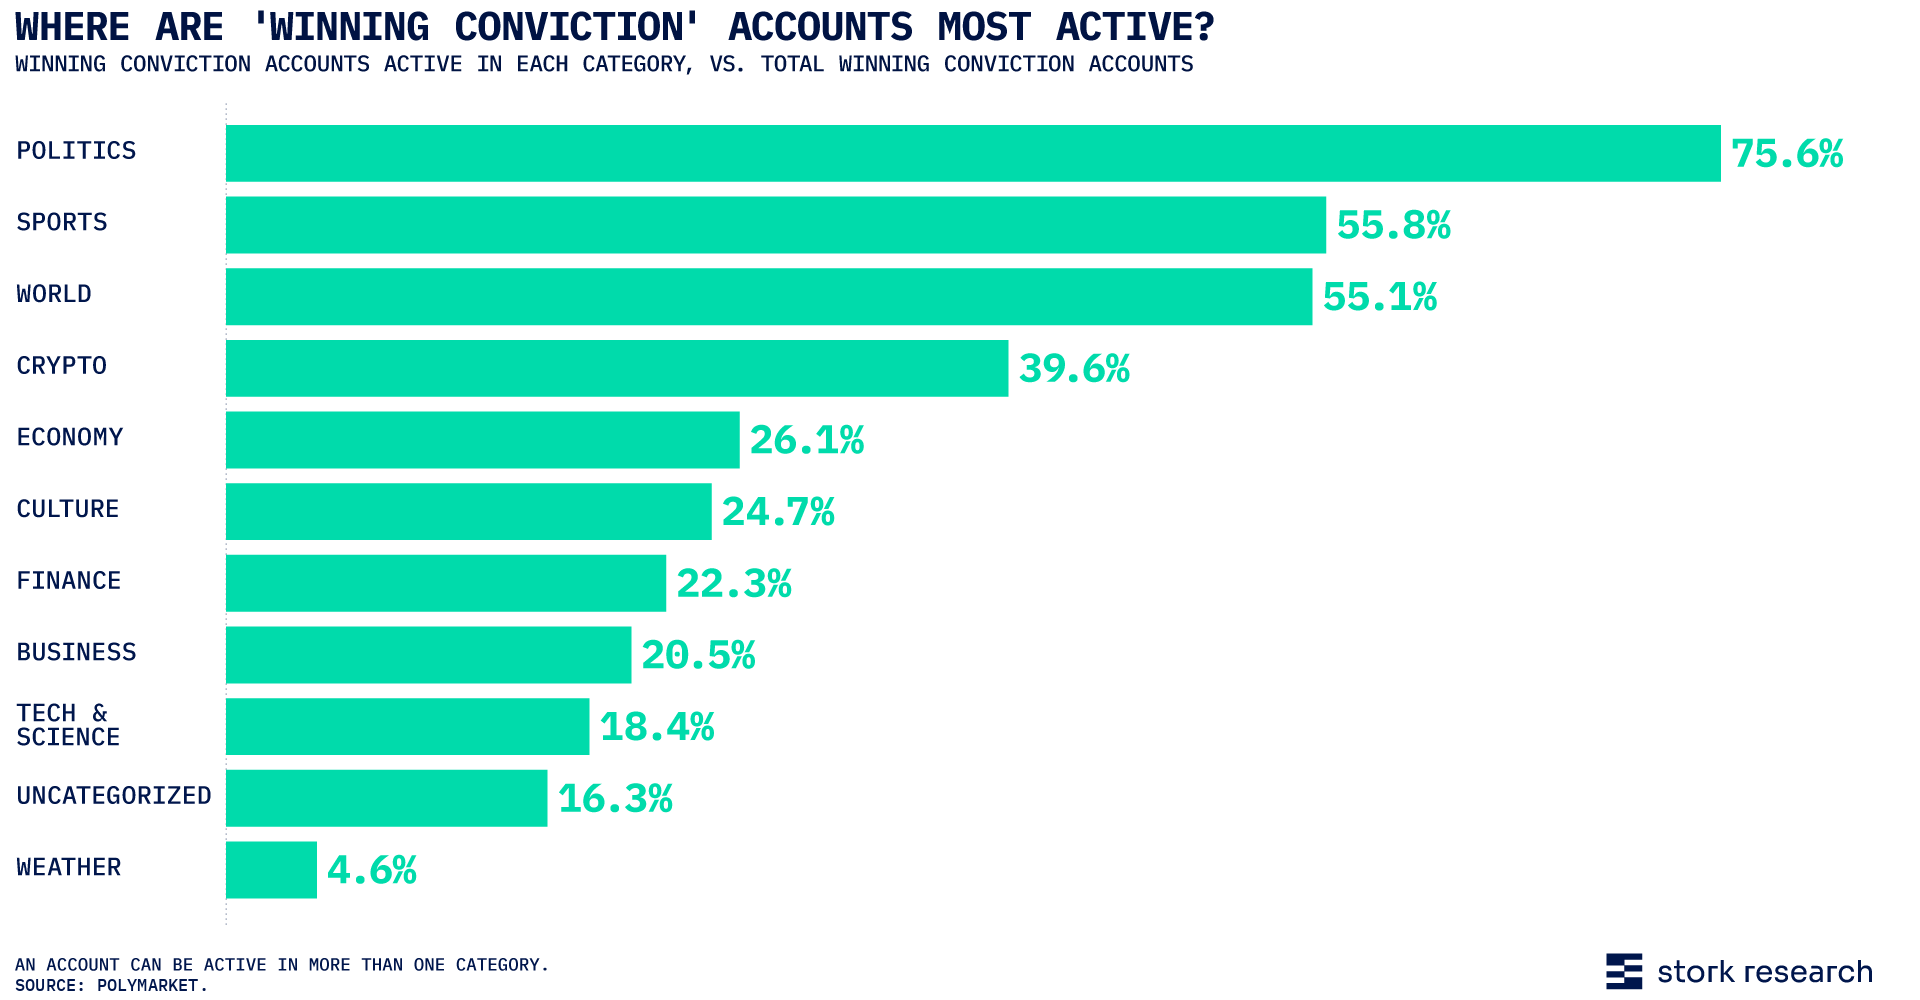
Three in four Winning Conviction accounts have bet on politics. Sports (55.8%) and world events (55.1%) come next, then crypto (39.6%). An account can be active in more than one category, so the shares add to more than 100%.
Raw counts favor the busiest categories, so we also measured the cohort against every account ever active in each category.
On this measure, World leads at 0.014%, followed by Politics (0.012%), Business (0.011%) and Finance (0.010%). Sports drops to 0.008%, Culture to 0.007% and Crypto to 0.006%.
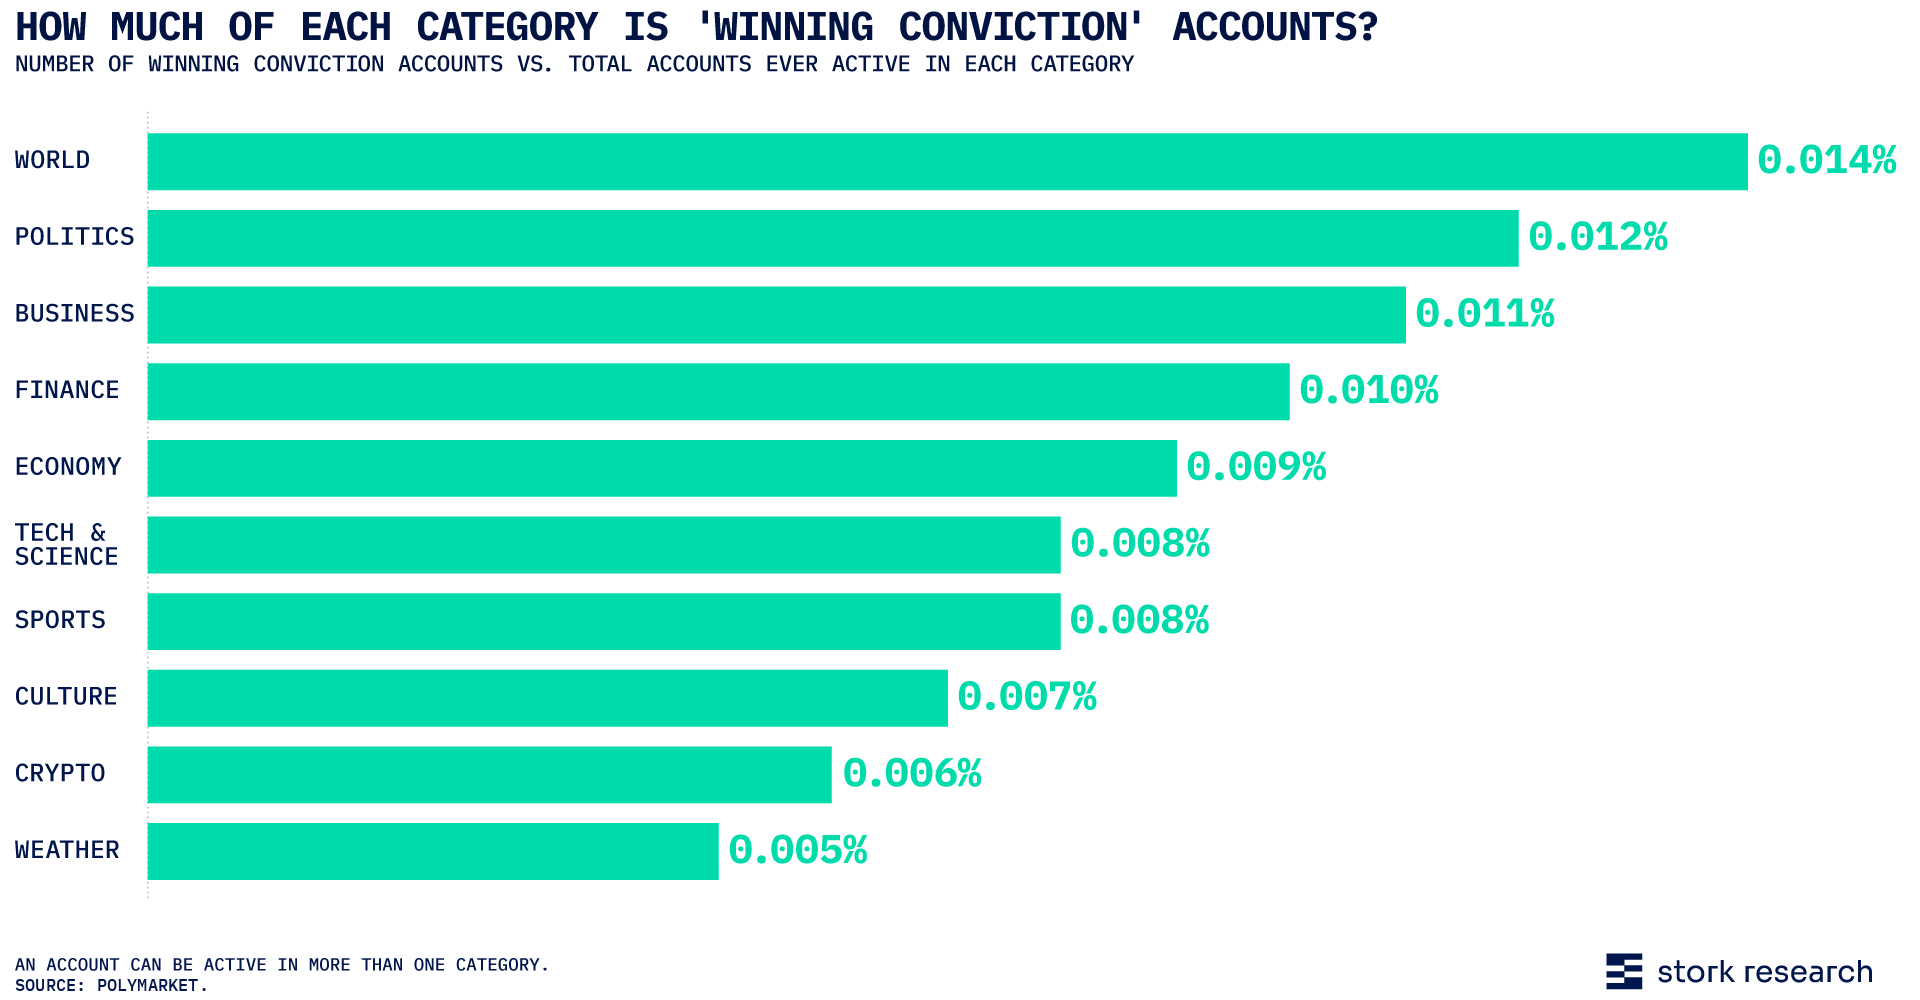
Prediction markets account level data bar chart shows where signal accounts are most active.
Takeaway: Relative to their size, categories with clear macro relevance hold the densest share of these accounts.
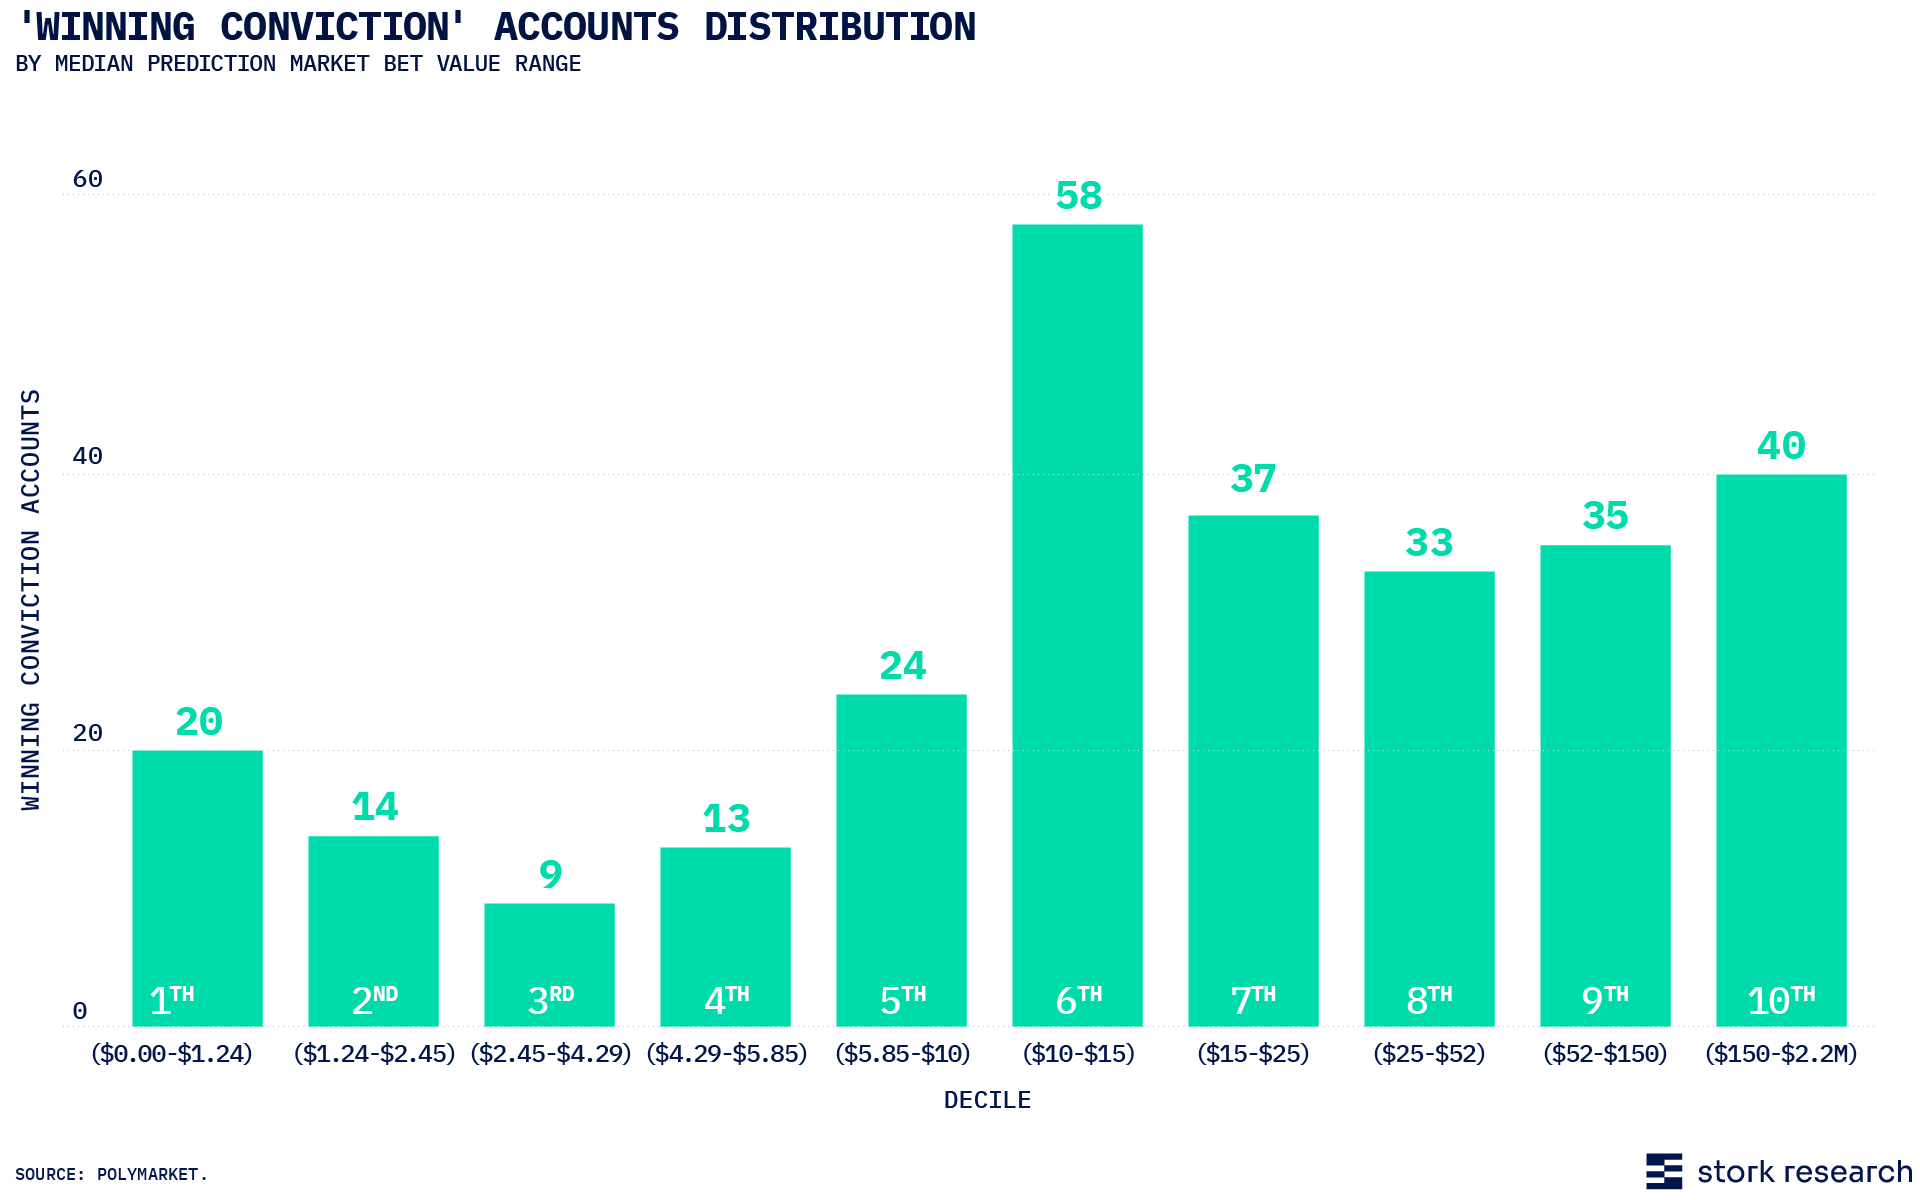
We left bet size undefined to keep the sample broad. Even so, the cohort leans toward the upper half of the range. The sixth decile, with a median bet of $10 to $15, holds 58 accounts, more than any other. The top decile, $150 to $2.2M, holds 40. A tighter study might keep only accounts with larger bets, where more money backs each call.
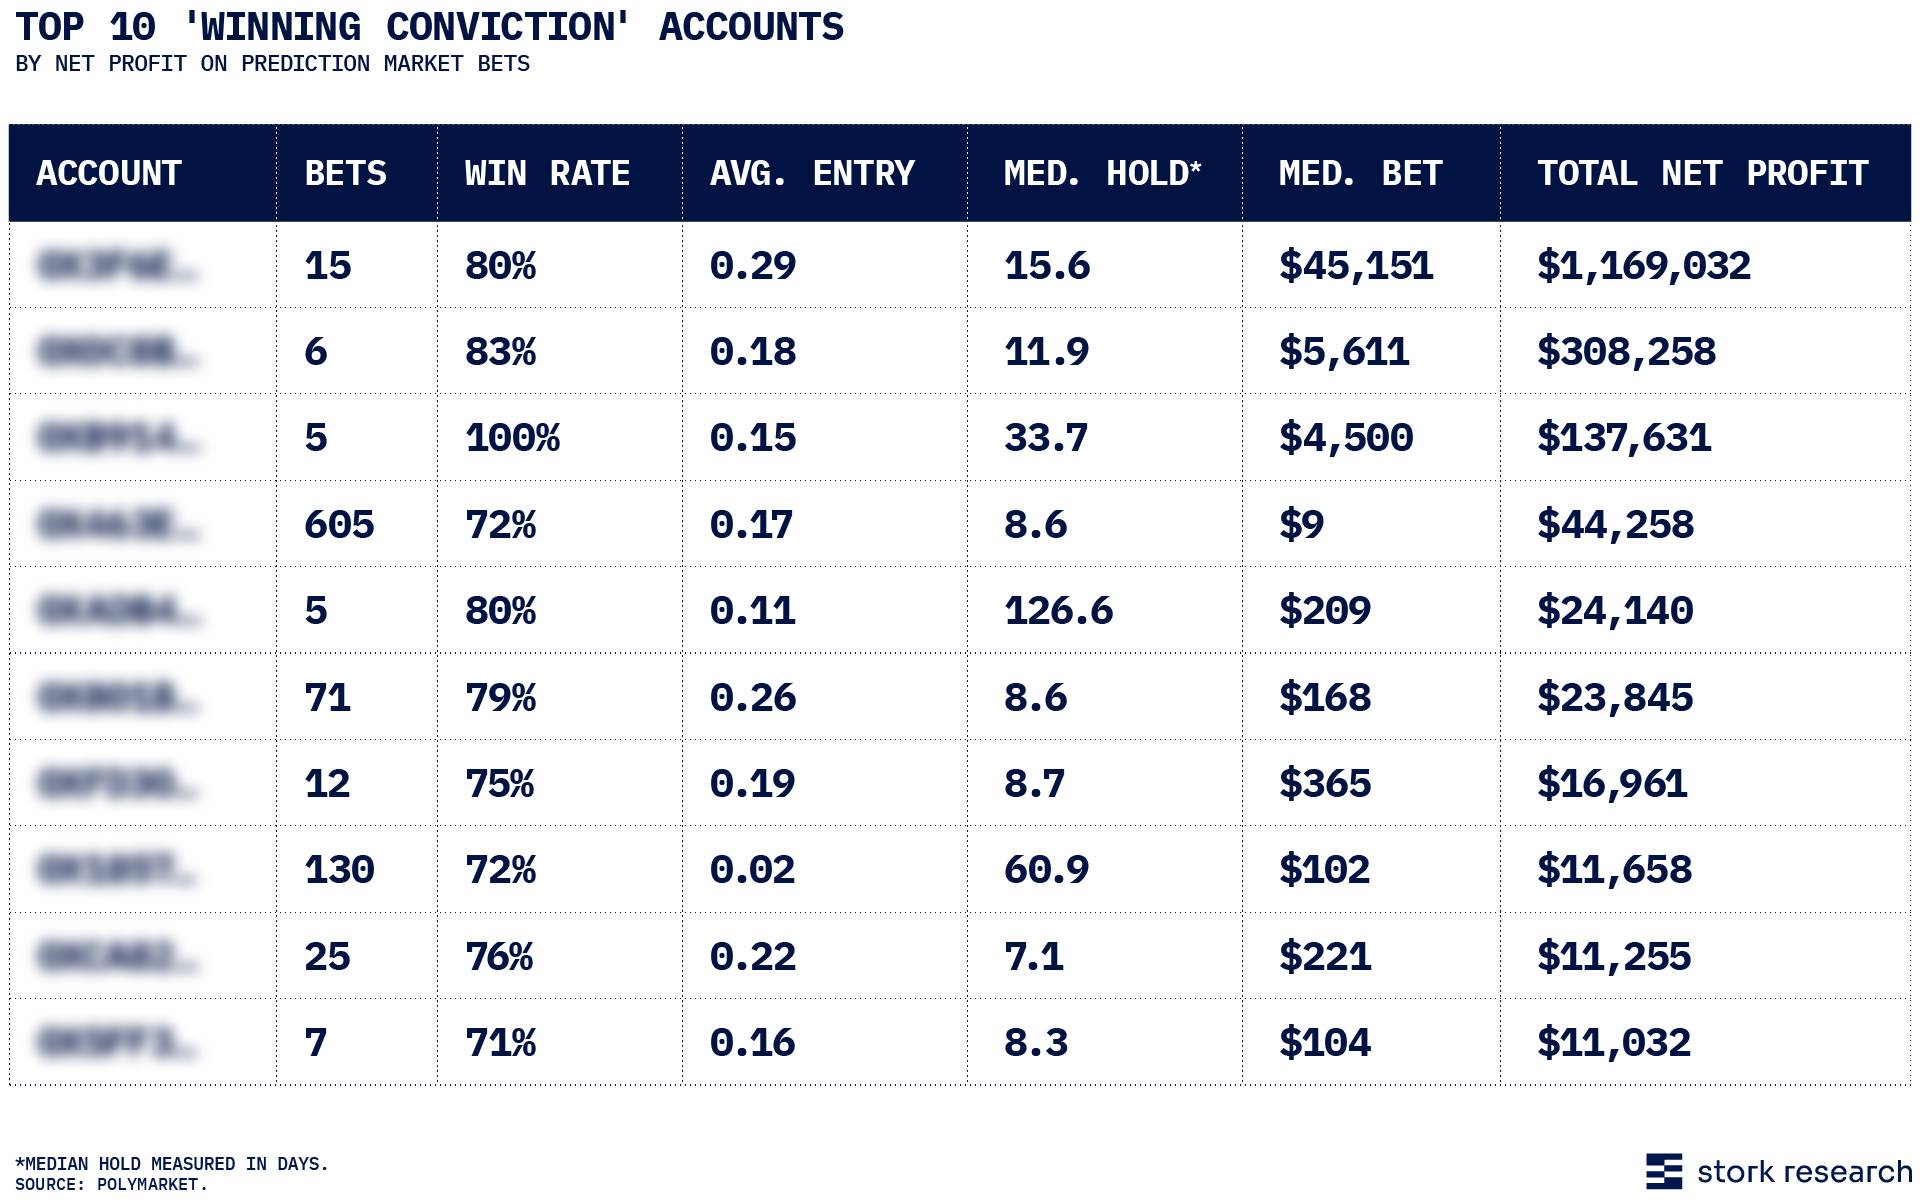
The 10 most profitable accounts in the cohort trade in very different ways. The leader placed 15 bets, won 80%, and netted $1.17M on a median bet of $45,151. The fourth placed 605 bets with a median size of $9 and won 72%, for $44,258. The third placed five bets and won all of them, for $137,631. Median holds run from 7.1 to 126.6 days.
Takeaway: Behavior tracking could improve with study of successful trading patterns.
Stork Market Data covers prediction markets with tick- and user-level data going back as far as 2022. That is enough history to backtest cohorts like this one and define them far more precisely than this demonstration does.
If you are exploring prediction market signals, get in touch: sales@stork.network.
The cohort metrics in this report are sample query parameters and should not be taken as investment advice. Source for all charts: Stork Market Data.