Perpetual futures (perps) on real-world assets (RWAs) have just crossed a $750B monthly volume threshold. Equities are now more than half the activity in these markets, having started the year at less than $100B. RWA perpetual futures volume has grown rapidly since then, and no category has grown faster than equity perps.
Top-level numbers like this have garnered attention, but equity perps markets remain early and untested. Are they ripe yet for institutional participants?
Central to that question is whether participants can reliably hedge derivatives positions in spot markets. One basic metric at the heart of that question is basis over spot: how closely does trading in the perpetual futures contract track the underlying spot market?
In this article, we’ll measure basis behavior in equity perps—specifically perps tracking US equities and ETFs. Stork Research already pulls data from exchange APIs on 15 leading RWA perps venues, and analyzes it in a weekly volume report (subscribe on LinkedIn or at stork.network/research).
For this article, we take the hourly close price from that data on the two largest venues by RWA perps volume, Binance and Hyperliquid (Trade[XYZ]), compare against Alpaca Securities data on underlying spot markets, and run a series of analyses based on spreads at hourly close.
Among Binance and Hyperliquid’s many US equity and ETF perps markets, we select the first 10 by listing date, since they have the most data available. All but one (EWJ on Binance, ranked 51st) are in the top quartile of US equity and ETF markets by 1H 2026 volume on their respective exchange.
Basis over spot is calculated as follows:
Equity perps run wider and consistently more positive than benchmarks. This holds true whether compared against traditional index derivatives or the crypto perpetual futures that track bitcoin and ether.
In liquid TradFi equity derivatives, tight basis to spot is expected. One academic benchmark for magnitude puts the average absolute basis across 18 developed-market equity index futures at 57 bps annualized.
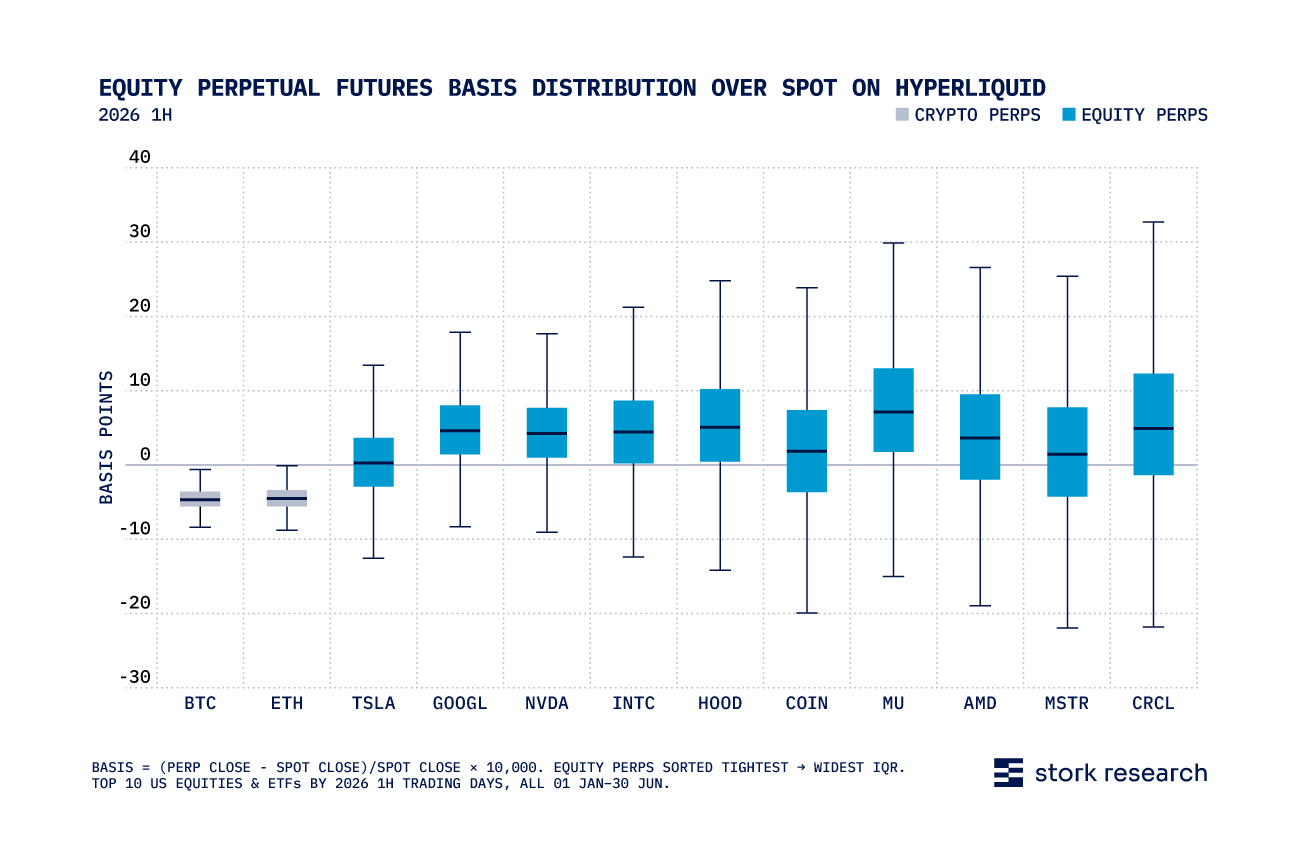
These figures come from dated futures, where convergence to index is guaranteed at expiry. Perpetual futures, on the other hand, are tethered to their index by funding rates. The NBER paper cited above shows that TradFi tolerates real, persistent deviation from spot even in the most liquid, well-arbitraged markets in the world. Equity perps showed median bases of 1–9 bps, with interquartile ranges (IQR) of 6-21 bps. This isn’t tighter than tradFi, but it is within a similar range, indicating a functioning derivatives market.
For further reading on RWA perpetuals market health, download our in-depth paper: RWA Perpetual Futures Sobriety Test.
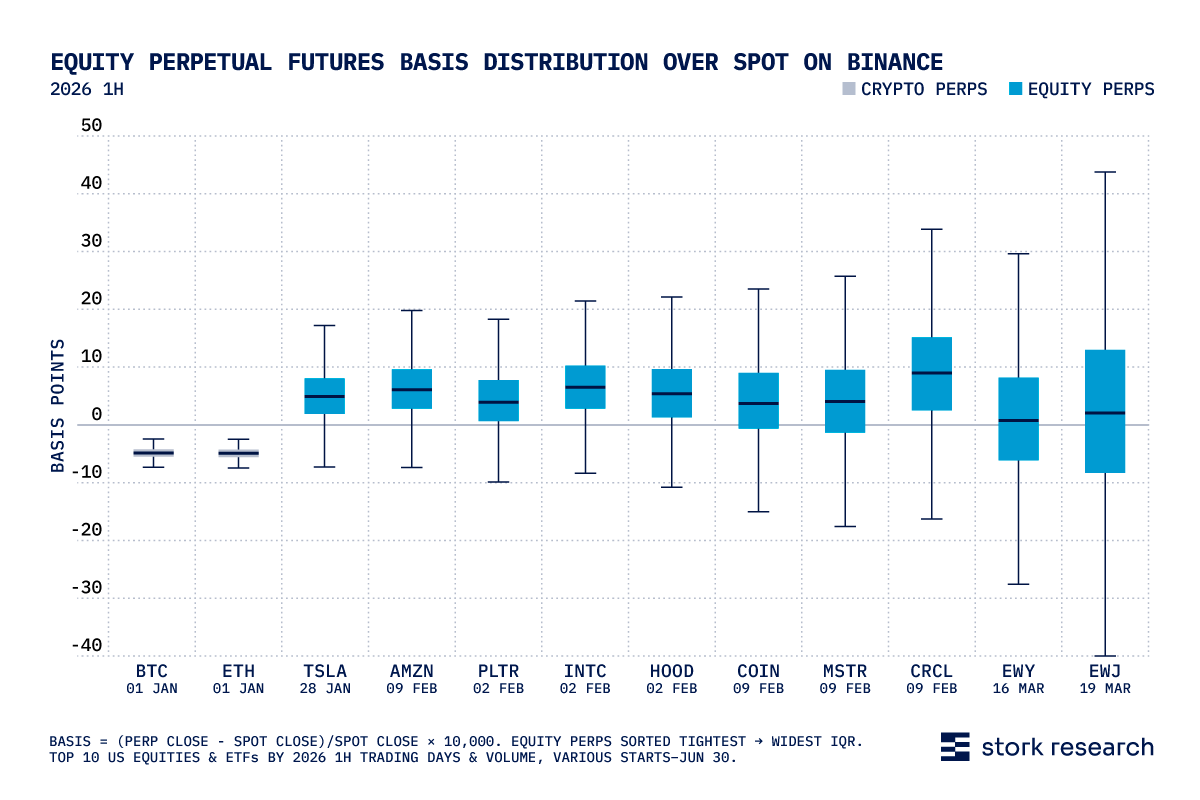
Bitcoin (BTC) and ether (ETH) anchor the tight end of the distribution, with medians of -4.9 bps each and IQRs of 1.2 and 1.3 bps across 4,344 hourly observations. Equity perps show a different picture. Median basis ranges from +0.8 bps (EWY) to +9.0 bps (CRCL). IQR ranges from 6.2 bps (TSLA) to 21.3 bps (EWJ). The gap between crypto and equity perps reflects a structural difference: BTC and ETH perps on major venues are primary price discovery markets. Equity perps are not. They track price signals generated on the Nasdaq, NYSE, and other highly liquid traditional venues.
Basis distribution is calculated as follows:
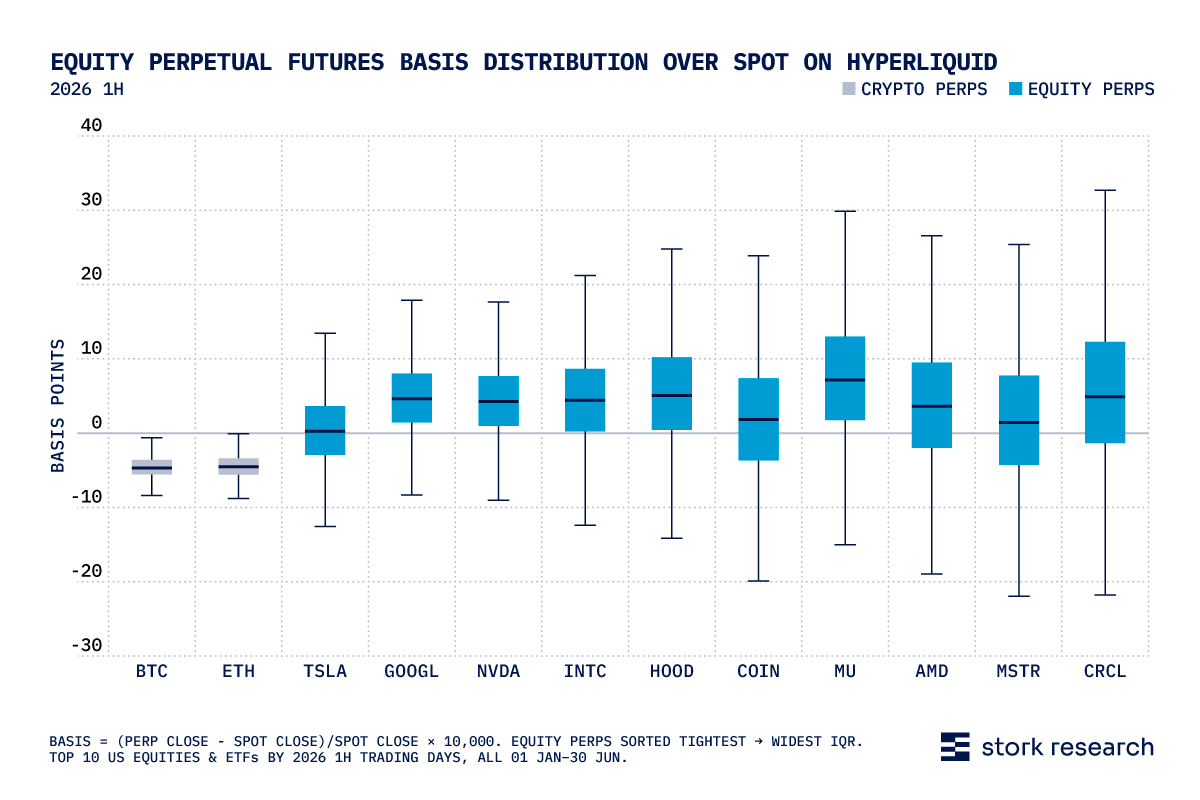
BTC and ETH medians are -4.7 and -4.5 bps with IQRs of 2.0 and 2.2, slightly wider than on Binance but still substantially tighter than any equity listing. On Hyperliquid, TSLA shows a median of +0.3 bps, and COIN and MSTR fall below 2 bps—tighter medians than their Binance equivalents. IQRs are comparable: TSLA 6.6 bps, COIN 11.0, CRCL 13.6, MU 11.2.
![Equity Perpetual Futures (TSLA) on Binance Basis Over Spot by Session (after hours, overnight [BOATS], premarket, and regular): Line graph vs time.](https://cdn.prod.website-files.com/67a9d2248b15bff5085d2b83/6a735b0260663e0866afcbb6_02_TSLAPerpFuturesOnBinance_BasisOverSpotBySession_V2.png)
Binance launched its first equity perp, TSLA, on Jan. 28, 2026. Barring outlier spreads in the opening days of trading, session medians are nearly identical across all four windows: regular 4.80 bps, pre-market 5.21, overnight session on Blue Ocean ATS ("BOATS") 5.06, after-hours 4.46. That’s a range of less than 0.8 bps, showing these markets track well even in the thin, overnight hours, where BOATS is widely referenced across exchanges and data providers.
Standard deviations are also comparable: 4.15 (regular) to 5.48 (after-hours), with no session dramatically noisier than another. The uniformity is the main finding: the basis on Binance's TSLA perp is structurally persistent and shows no meaningful variation by time of day.
![Equity Perpetual Futures (TSLA) on Hyperliquid Basis Over Spot by Session (after hours, overnight [BOATS], premarket, and regular): Line graph vs time.](https://cdn.prod.website-files.com/67a9d2248b15bff5085d2b83/6a735b1d548c4628abdececd_04_TSLAPerpFuturesOnHyperliquid_BasisOverSpotBySession_V2.png)
Session medians on Hyperliquid are tighter than Binance and centered near zero: regular +0.37 bps, pre-market +0.27, overnight BOATS +0.26, after-hours 0.00. Standard deviations range 4.89 to 5.37, essentially the same as Binance. As on Binance, the four session lines track one another closely over time. No session is structurally wider. The lack of session differentiation on both platforms argues against a market-hours explanation for basis width.
This brief report indicates the most liquid equity perps markets are effectively tracking spot, even when operating 24/5. But that’s a long way from saying they’re mature. While crypto perps are known to set price in major digital assets, equity perps follow price discovery on long-established and much more liquid spot markets (at least, during market hours). That shows in the difference between spreads here and on BTC and ETH perps, where leading venues like Binance and Hyperliquid set the price.
Similar to our recent analysis of order flow balance on perpetual futures markets, this data indicates a functioning market with progress to make, before it reaches a mature state.
The patterns shown here also raise questions. For example, why are equity bases positive? Why crypto negative? We’ll save these questions for a future investigation.




_CoverImage_V1.png)