The GENIUS act enshrined 1:1 backing as a standard in real-world assets (RWAs) represented by tokens onchain. That standard isn’t going to work for tokenized equities.
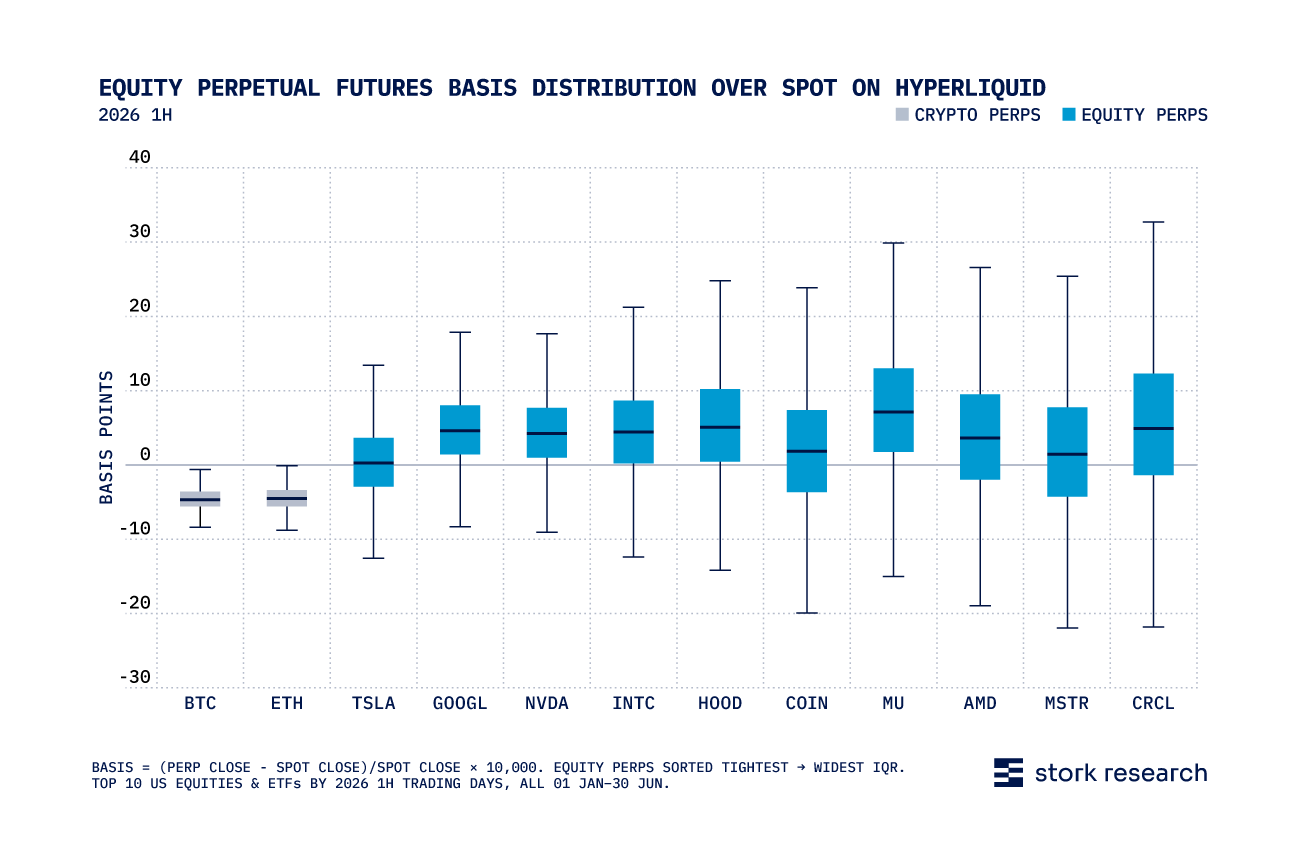
Corporate actions like stock splits and dividends impact one-share to one-token backing at the issuer level. At the exchange level, prices vary on two dimensions: some venues report the token price, while others report the underlying share price. Meanwhile, the most heavily traded tokenized stocks generally track the underlying well, but spreads vary widely by venue and pair. (For a look at basis over spot in equity perpetual futures, read our recent report.)
This report examines these issues, including a snapshot of the tokenized stock trading over a single 24-hour period on Oct. 1, spotlighting these data challenges.
A tokenized share stops being one share as soon as the issuer reinvests a dividend or the stock splits. Issuers of tokenized stocks adjust with a multiplier: 1 token = M shares. For most names at this stage, M is small—between 1.000 and 1.010 for most large names. However, there are outliers:
The token itself exposes both units; what is visible or delivered to the end user or venue depends on where the token sits.
Exchanges may quote the tokenized stock in the token price or in the implied price of the underlying shares. Following its November, 2025 10-for-1 split, Netflix (NFLX) became an extreme example, as the chart below illustrates across two issuers and nine venues.
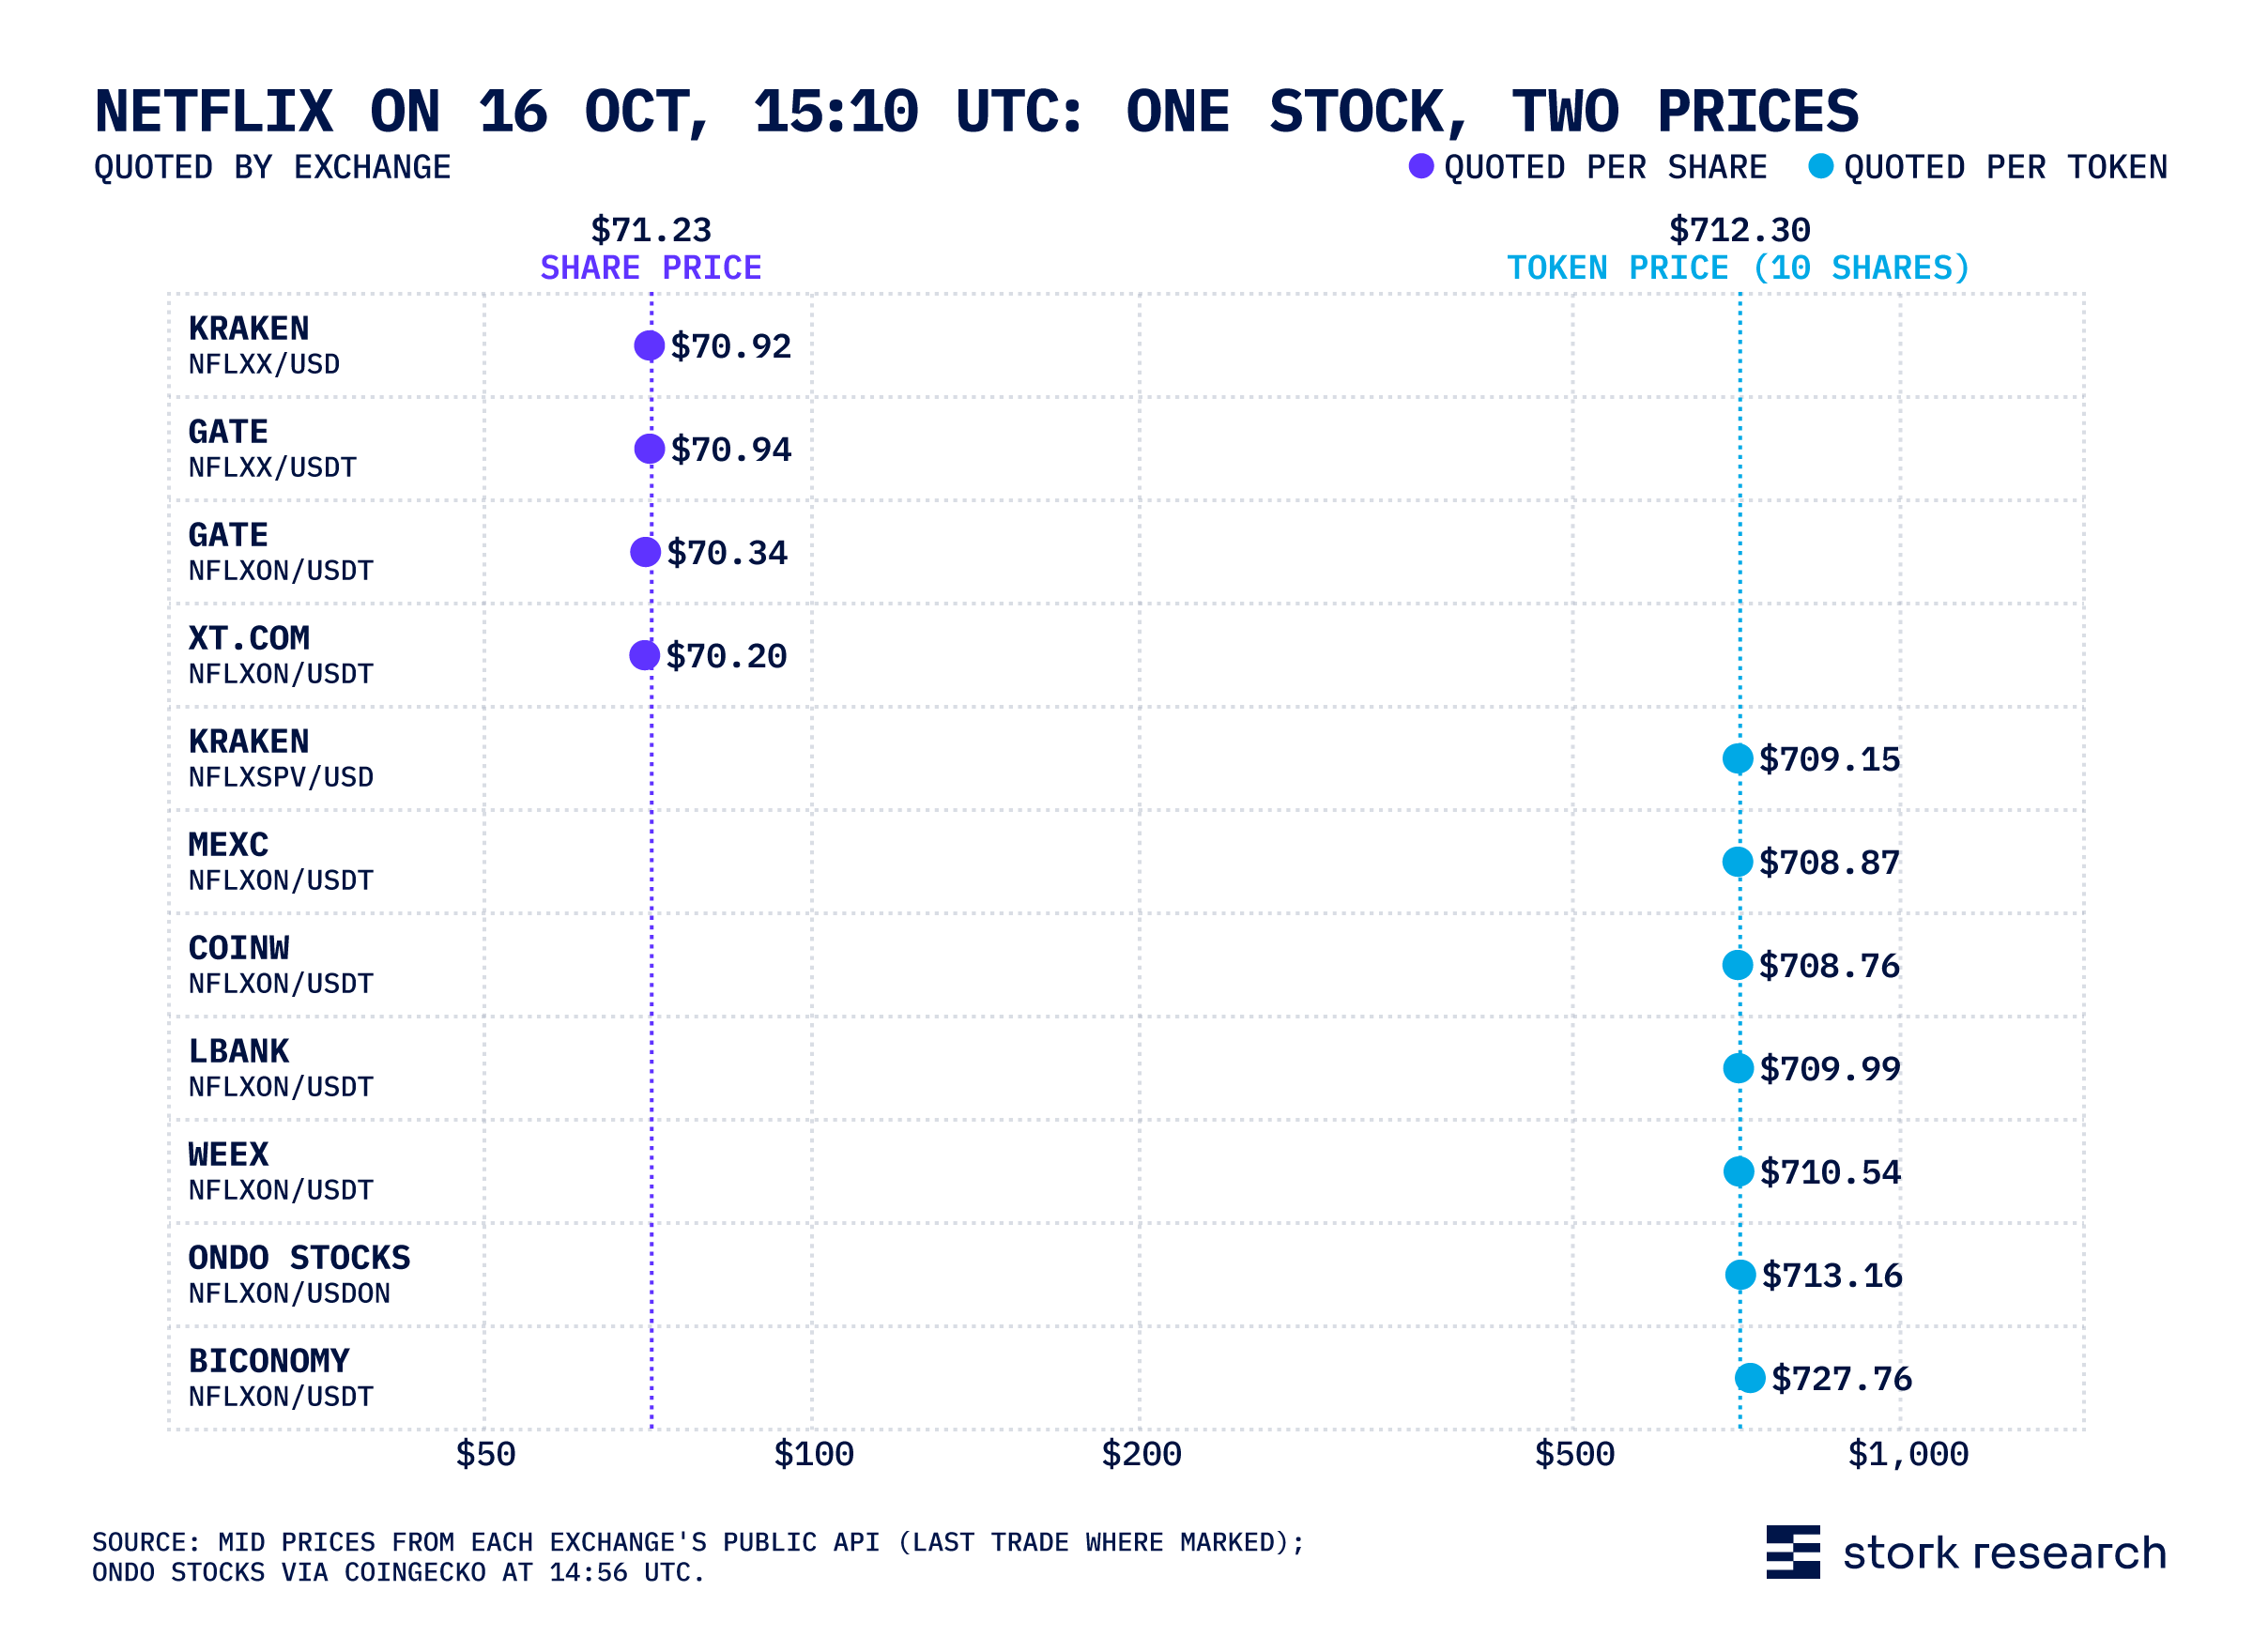
The chart shows the same instrument, in the same minute, with a 10X gap. NFLX traded at $71.23; one token is 10 shares, so the per-token price is $712.30.
Takeaway: Normalization has to happen per venue and per chain, not per token.
Venue pricing can change, and these changes are not always smooth or consistent. For example: Gate, a centralized exchange based in the Cayman Islands, quoted everything per token until Oct. 12, when it halted the five split-adjusted pairs (NFLXX, NFLXON, CRWDX, TQQQX, AZNX) after about 02:00 UTC and relaunched them at 13:30 UTC on a per-share basis.
This treatment was not consistent across all names on the exchange:
The tokens themselves are unchanged: Gate's deposit addresses are the xStocks Solana mints.
Takeaway: A venue's convention can change overnight, so any normalization needs monitoring.
Questions about normalizing token price across venues and issuers beg another question: how big is the basis gap between the onchain token price and the price of the underlying stock? The answer is: for the most part, tokenized equities do track the underlying stock, but there are some exceptions.
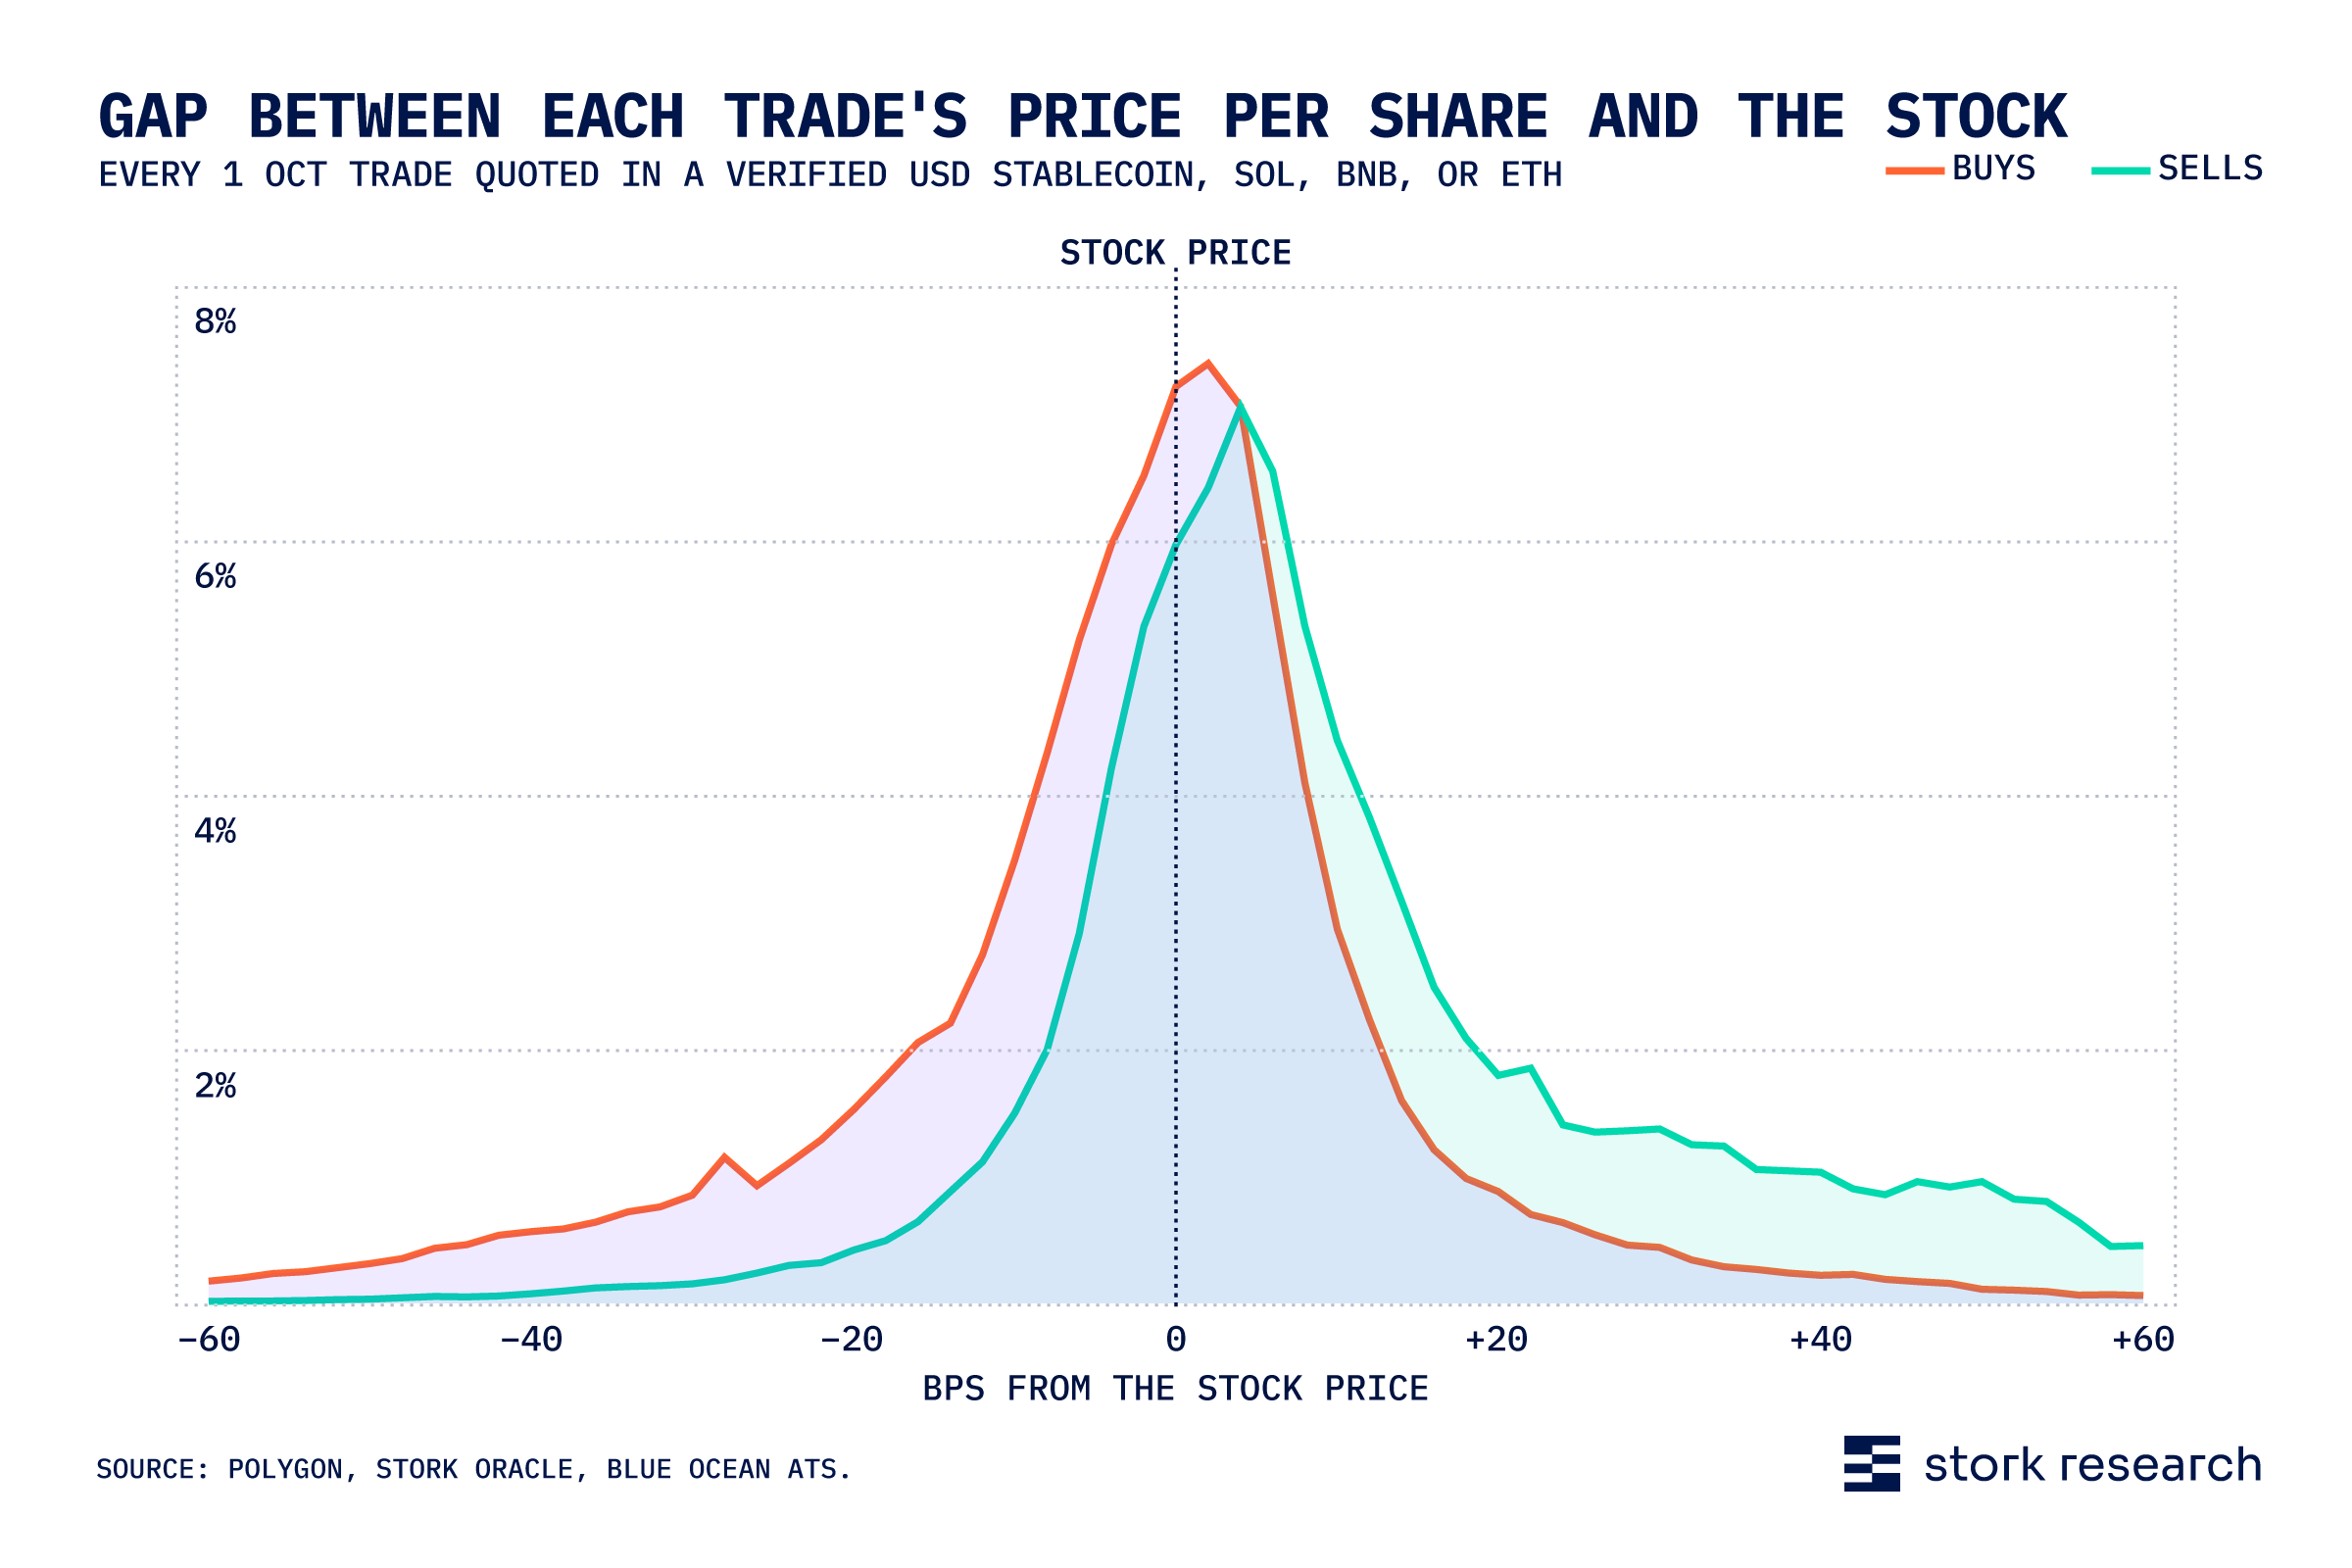
The chart shows every Oct. 1 trade quoted in SOL, BNB, ETH, or a verified USD stablecoin, converted to dollars per share and compared with the stock at the same second. That covers 2.51M trades and $623M in volume. The reference is Polygon's 1-second bars from 04:00 to 20:00 ET and Stork's 24/5 feed (Blue Ocean) overnight. Launchpad curves, memecoin-quoted pairs and pre-IPO tokens are left out.
Buys print a median 7.2 bps above the stock and sells 1.4 bps below, so most of the gap is the spread and pool fee a taker pays; the midpoint sits about 3 bps above the stock. Beyond the axis: 6.5% of buys above +61 bps, 3.5% of sells below −61 bps.
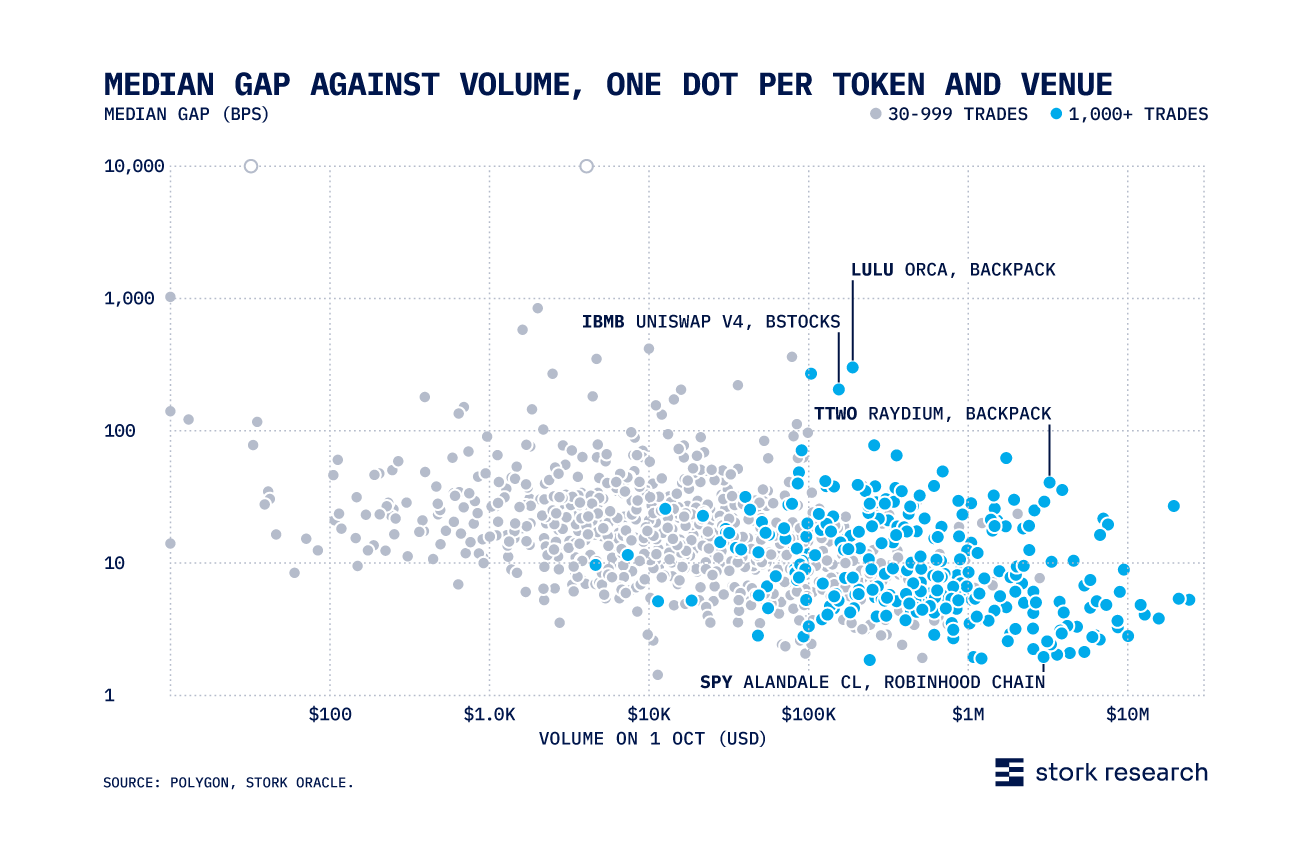
The following plot shows how the most heavily traded token pairs cluster close to the underlying share price, while thinly traded pairs drift.
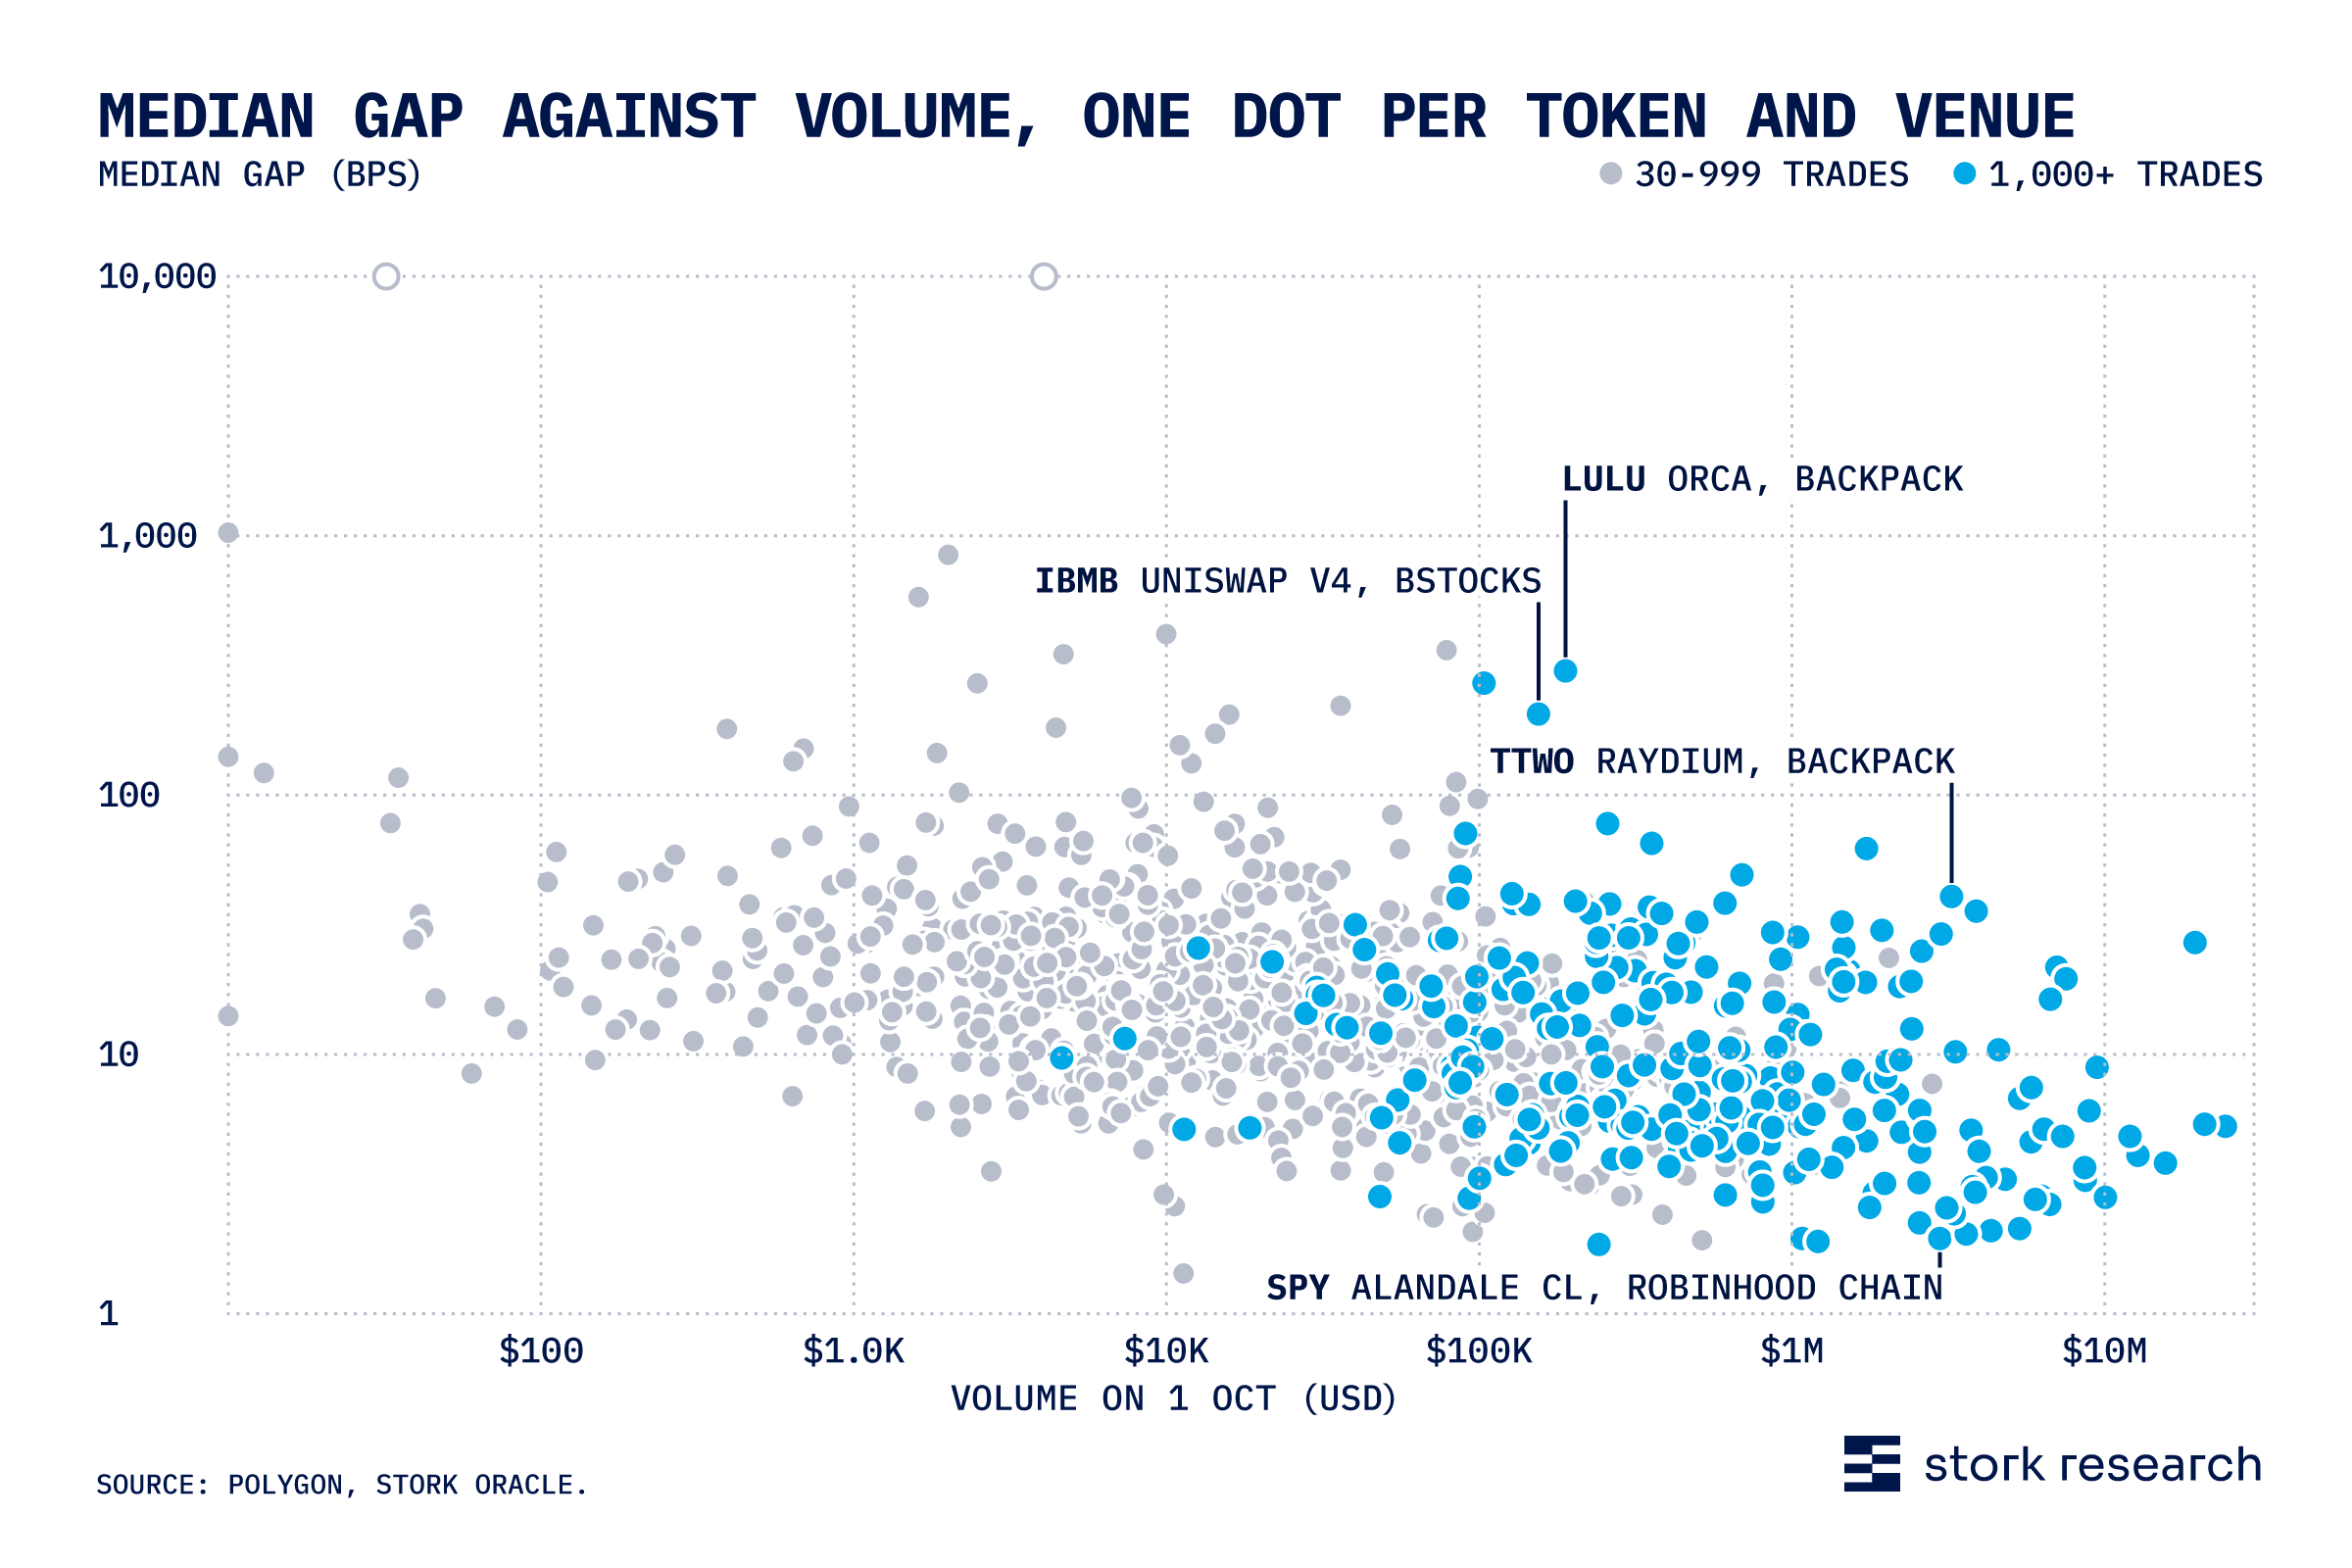
This scatter plot tracks 1,017 (token, venue) pairs with at least 30 trades, over regular and extended hours. 72% of dollar volume sits in pairs whose median gap is 10 bps or less, 89% in pairs at 25 bps or less, and 0.15% in pairs above 100 bps.
For each stock, every minute, we took the most recent tokenized trade across all tokens and venues, against the stock at that moment.
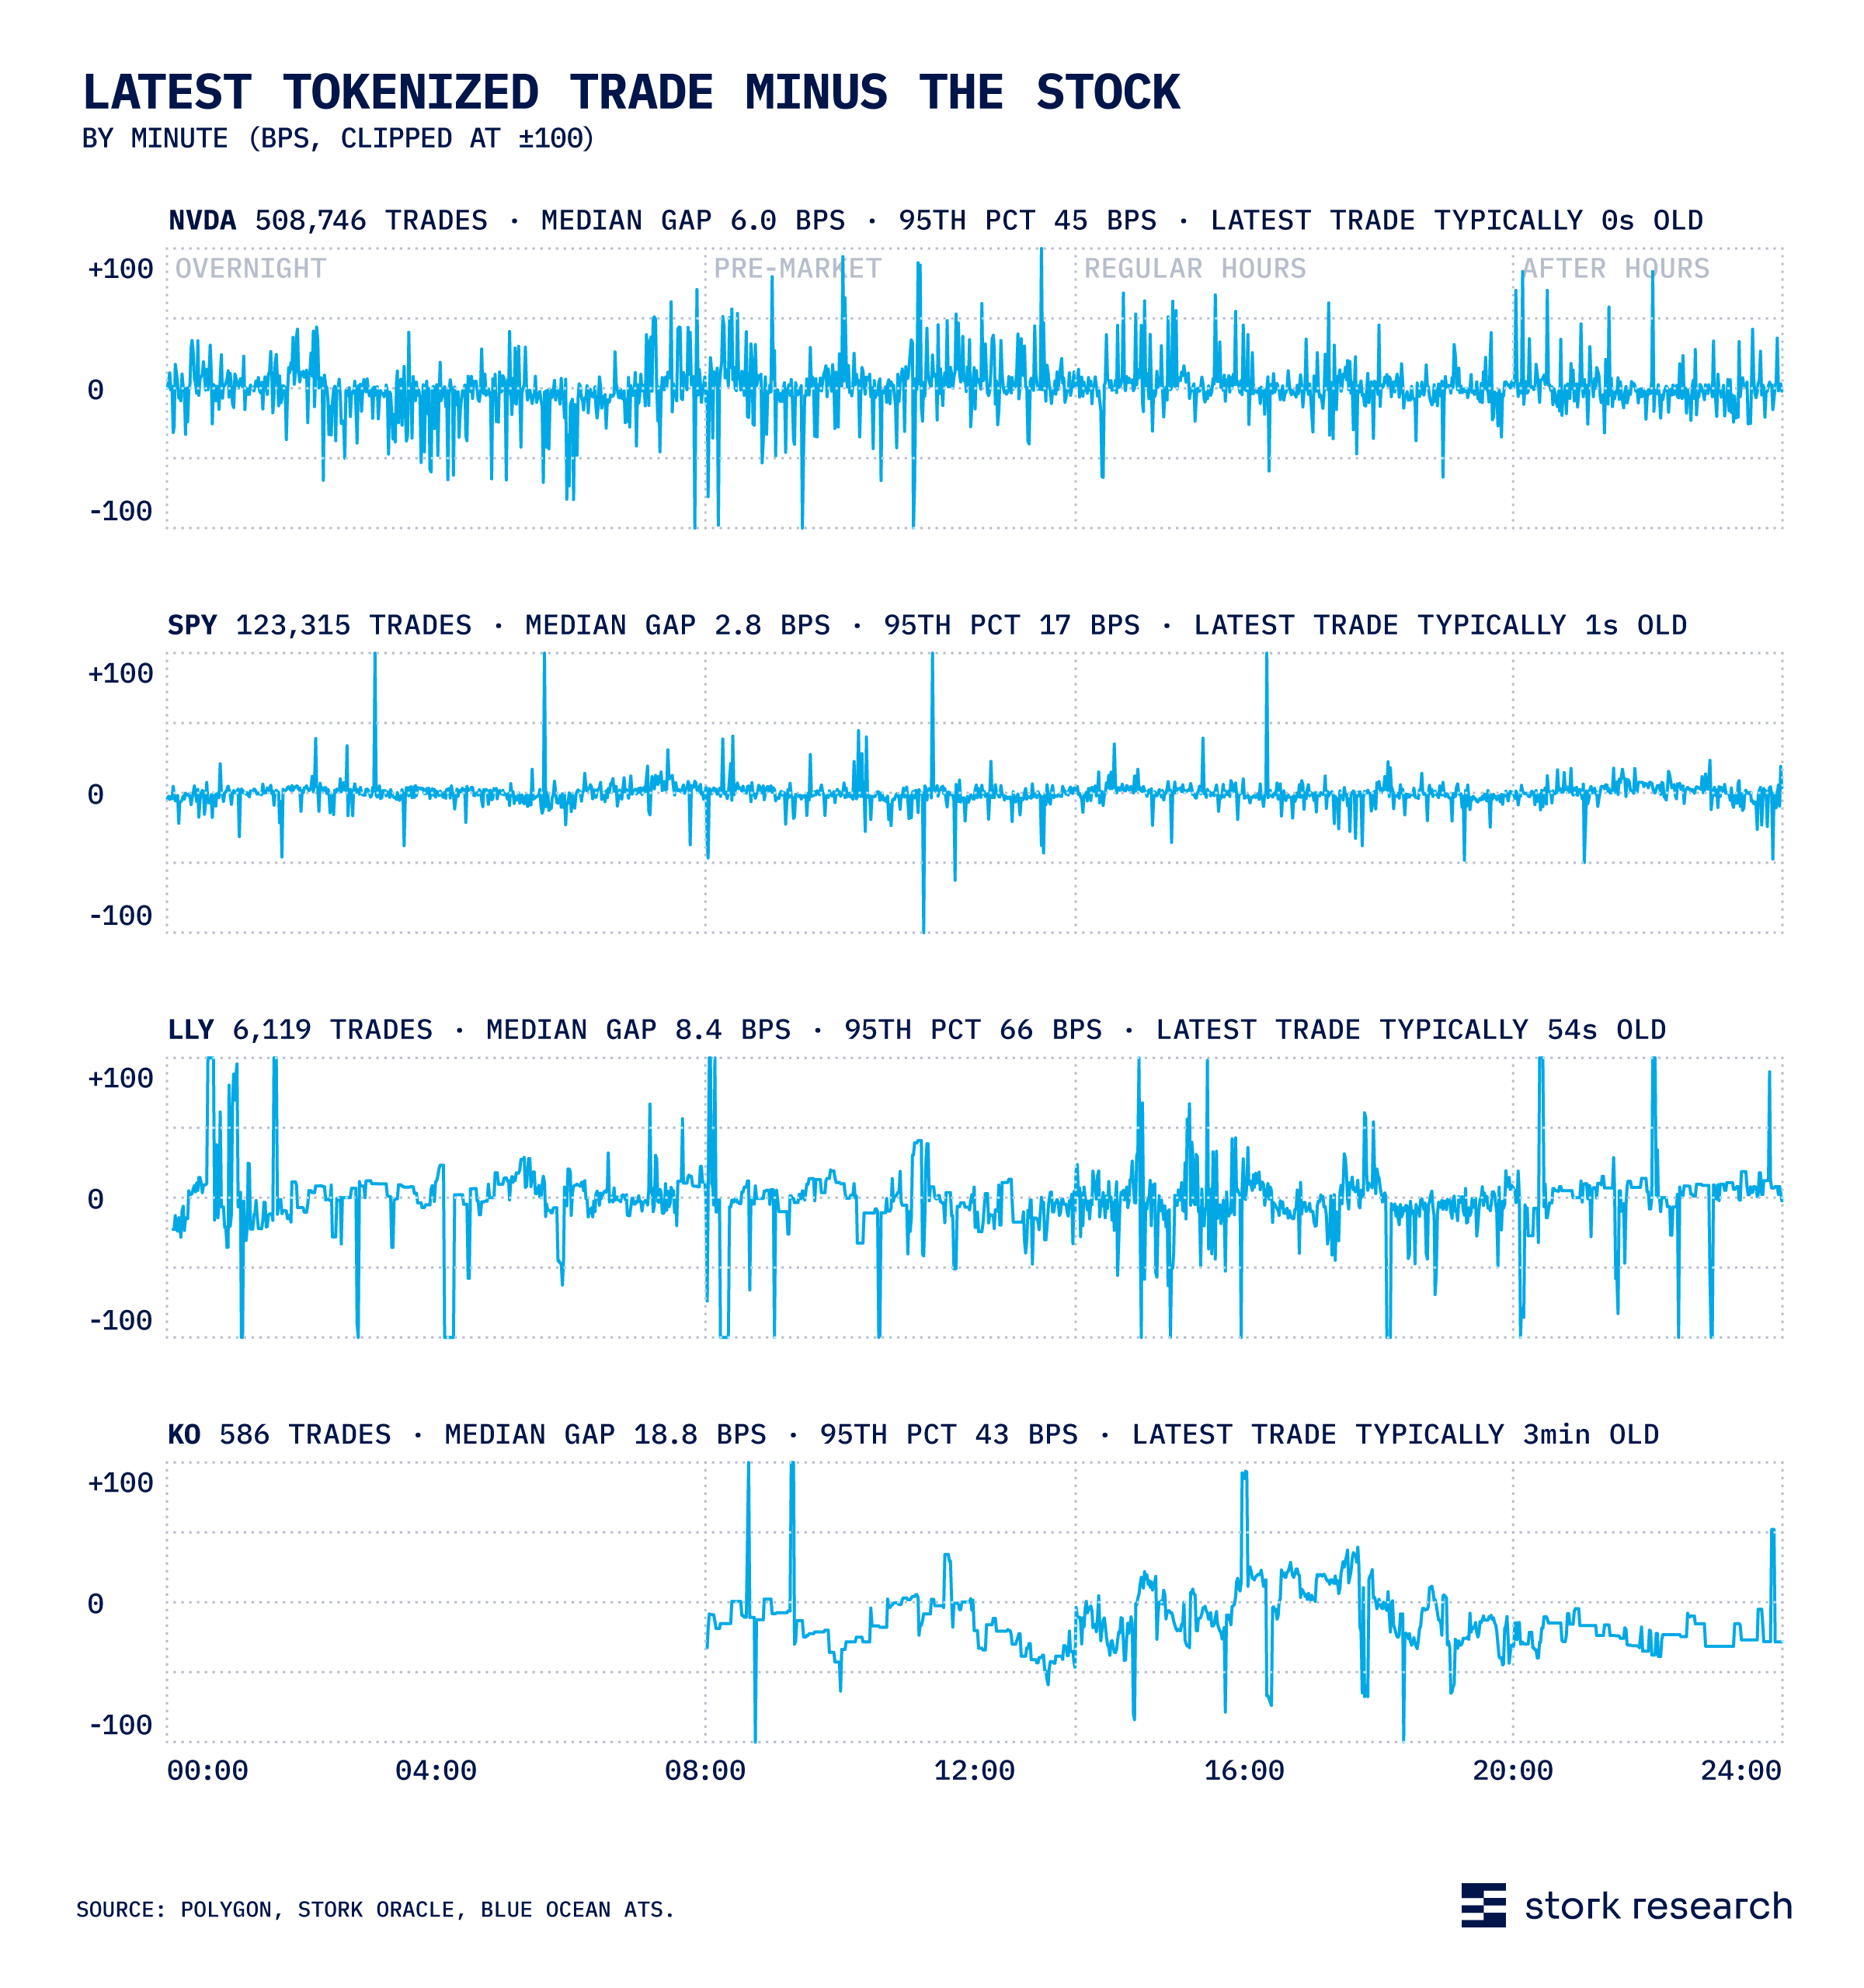
NVDA trades every second, so its latest trade stays within a few bps all day. KO trades a few hundred times a day, so its latest trade is often minutes old and wanders 20–40 bps.
The next chart shows the median over stocks by median minute gap, bucketed by recency of latest trade.
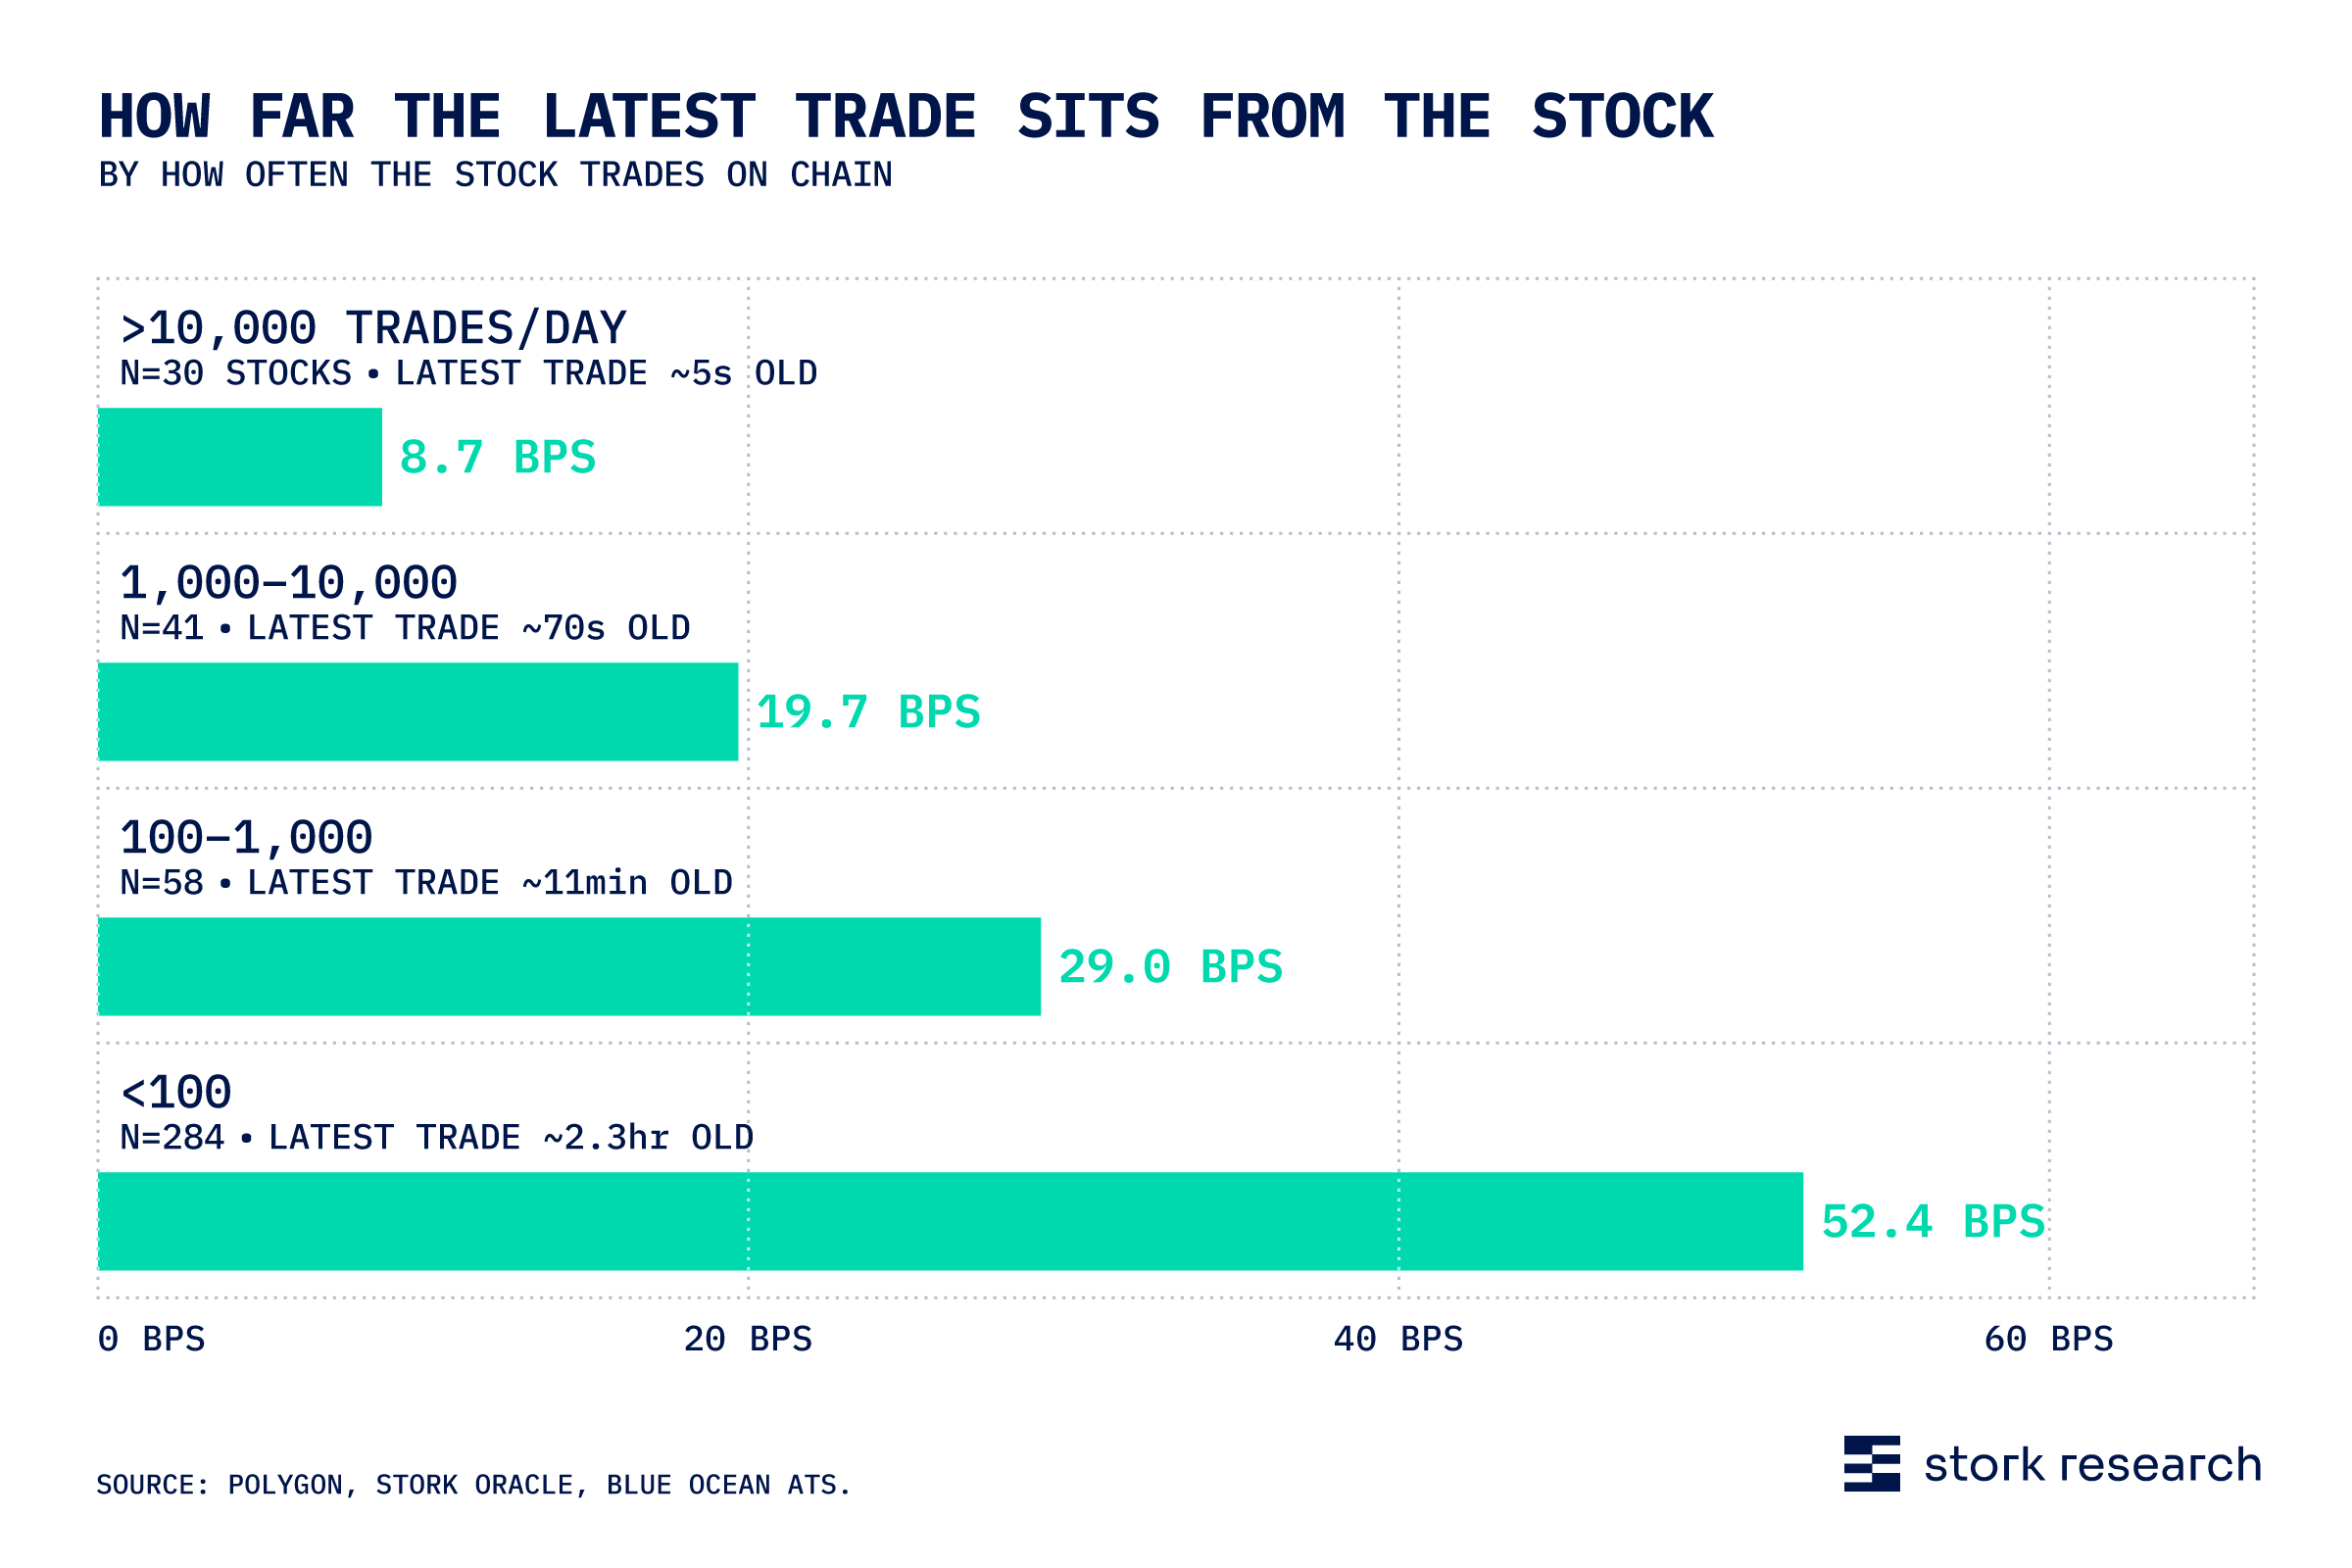
The 30 busiest stocks carry 93% of trades; the 284 thinnest average 14 trades a day and their latest trade is typically 2.3 hours old. For thin names, "latest trade" is not a usable price. Dropping trades under $100 tightens the busy names' tails: QQQ's 95th percentile falls from 31–38 bps to 15–20 bps.
Price discovery 24/7 is a major value proposition of onchain markets and tokenized stocks. We compared tokenized stocks to underlying prices on Blue Ocean ATS (BOATS) to see how well onchain markets track underlying shares overnight, compared with other sessions.
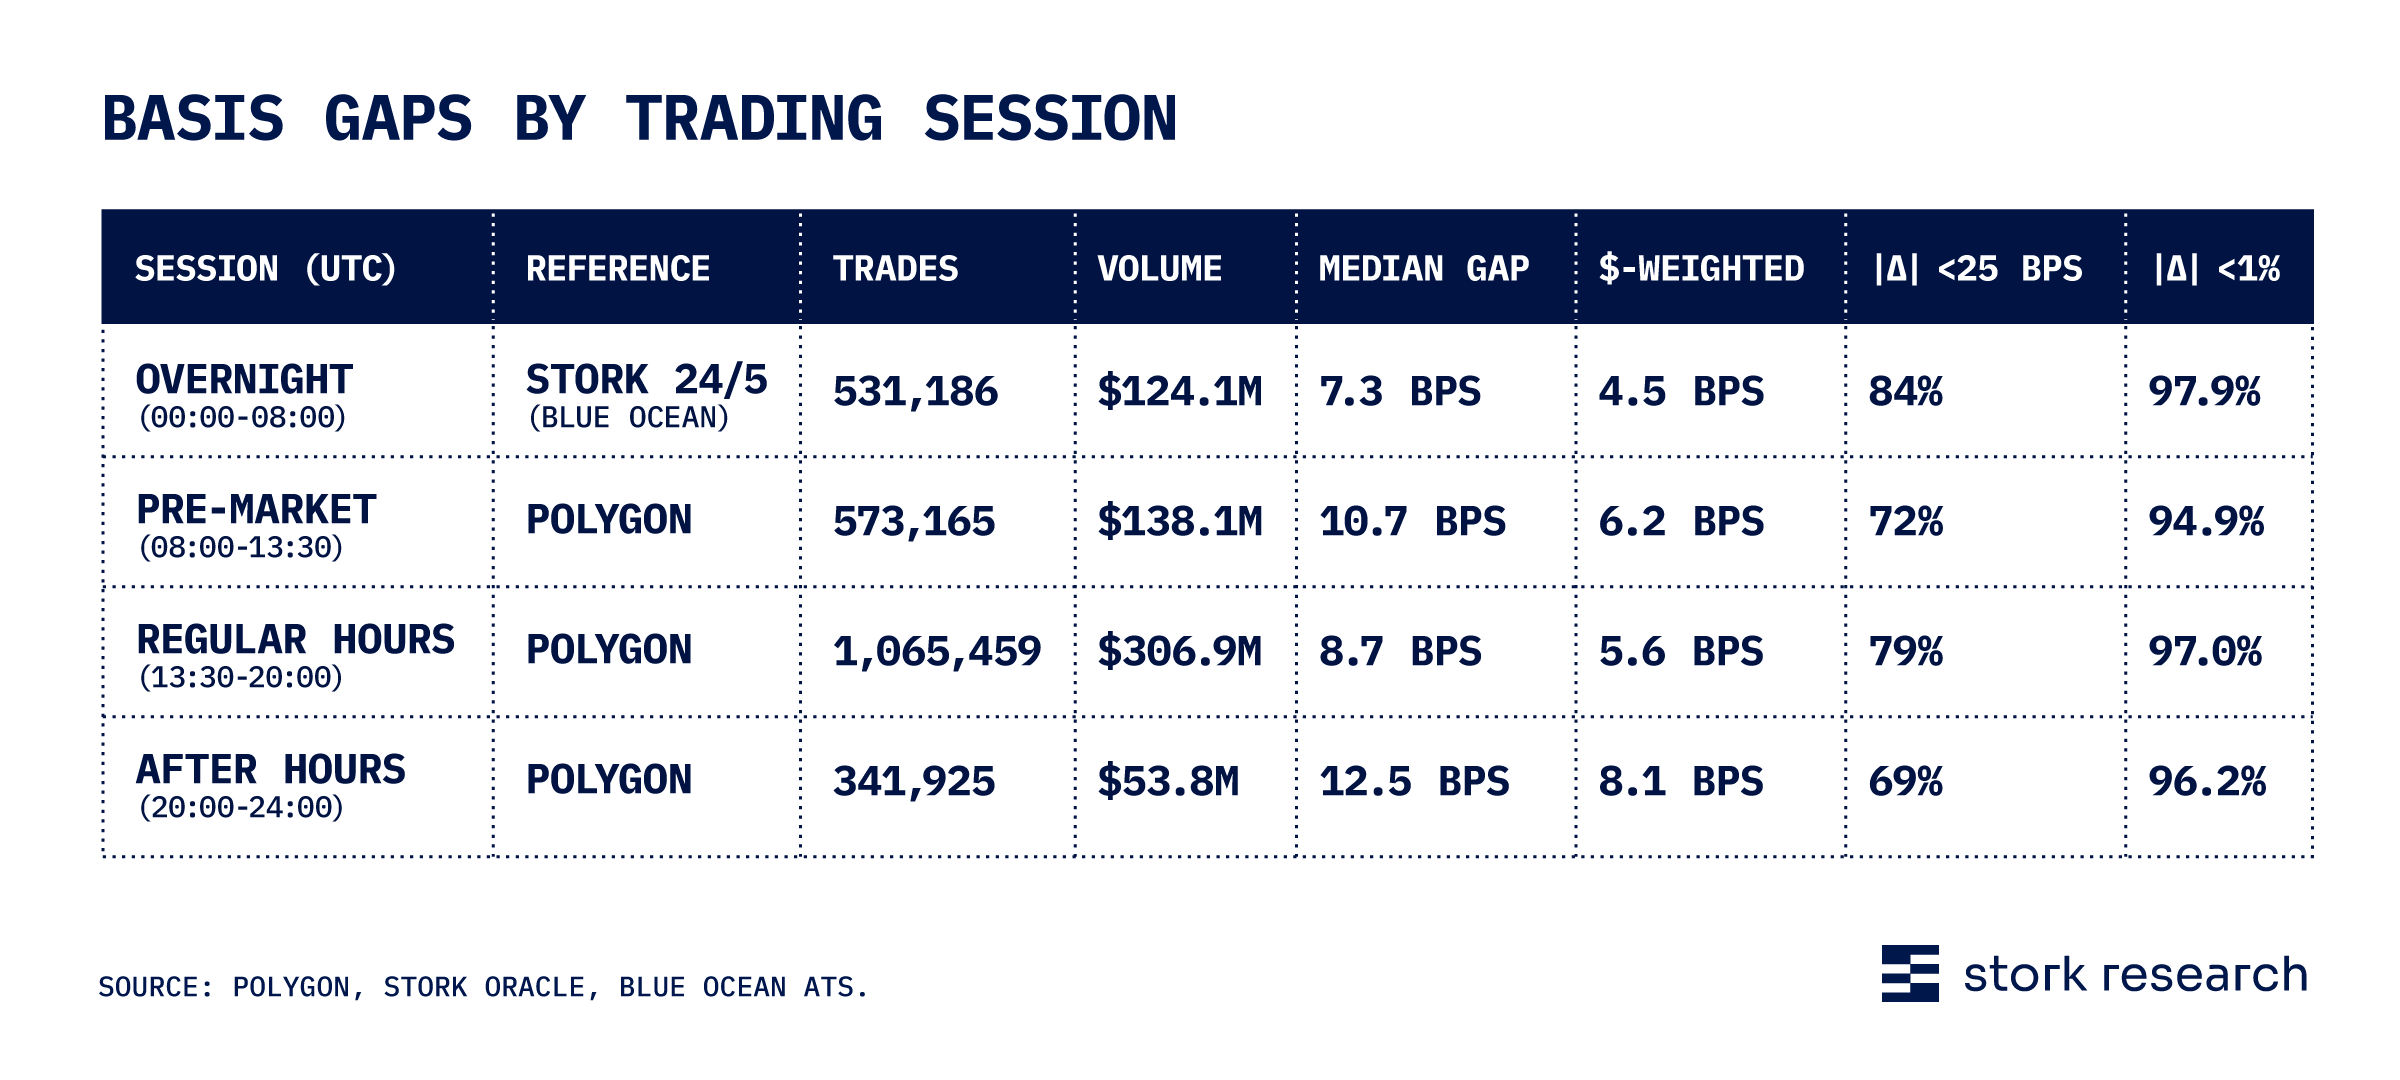
Overnight tracking is as tight as regular hours for liquid names. For thin names, Blue Ocean's overnight mid is itself unreliable (RoboStrategy's token looked 3.8% cheap overnight and 0.5% cheap in regular hours).
A liquid core of tokenized equities has emerged that trades frequently and efficiently tracks the underlying share price, even through thin overnight hours. Beyond the most heavily traded “blue chips,” the market has significant maturing to do.
The early development of onchain trading in a small number of tokenized stocks presents significant opportunities in arbitrage, 24/7 trading, and onchain collateral. However, these opportunities will remain challenging to realize, without robust, monitored price normalization systems that span multiple layers: venue, chain, and issuer.